Max Est. MMI
7 km WSW of Holtville, CA
Ground Shaking Intensities — Interpolated ShakeMap MMI
3 sites| Location | MMI |
|---|---|
|
Holtville
CA |
IV |
|
Heber
CA |
IV |
|
El Centro
CA |
IV |
Seismic Station Observed MMI
MMI values are derived directly from observed ground motion measurements at seismic stations and are not spatially interpolated.
| Station | MMI |
|---|---|
| Bonds Corner, Omlin Residence (NP.5054) | IV |
| Desert Research Extended Center (CI.DRE) | IV |
| El Centro Array 11, McCabe School (NP.5058) | IV |
| Schaffner Ranch (CI.SNR) | IV |
| Fire Station (NP.5053) | IV |
Engineering Ground Motion Parameters
GMPE predictions provide an independent check on the ShakeMap interpolated intensities above.
ShakeMap relies on seismic station recordings; in areas with sparse station coverage — or
for large teleseismic events and earthquakes outside dense West Coast networks — ShakeMap
MMI can be inaccurate. A significant difference between ShakeMap and GMPE estimates is a signal
that the ShakeMap result should be treated as preliminary.
Also includes site Vs30 values and raw ground motion parameters (PGA/PGV).
Show ▼
Engineering Ground Motion Parameters
GMPE predictions provide an independent check on the ShakeMap interpolated intensities above. ShakeMap relies on seismic station recordings; in areas with sparse station coverage — or for large teleseismic events and earthquakes outside dense West Coast networks — ShakeMap MMI can be inaccurate. A significant difference between ShakeMap and GMPE estimates is a signal that the ShakeMap result should be treated as preliminary. Also includes site Vs30 values and raw ground motion parameters (PGA/PGV).
Site-Specific Vs30 Values
Shear-wave velocity in the upper 30 m, used for GMPE predictions.
| Location | Default Vs30 (m/s) | Site-Specific Vs30 (m/s) |
|---|---|---|
|
Holtville
CA |
760 | 218 |
|
Heber
CA |
760 | 228 |
|
El Centro
CA |
760 | 206 |
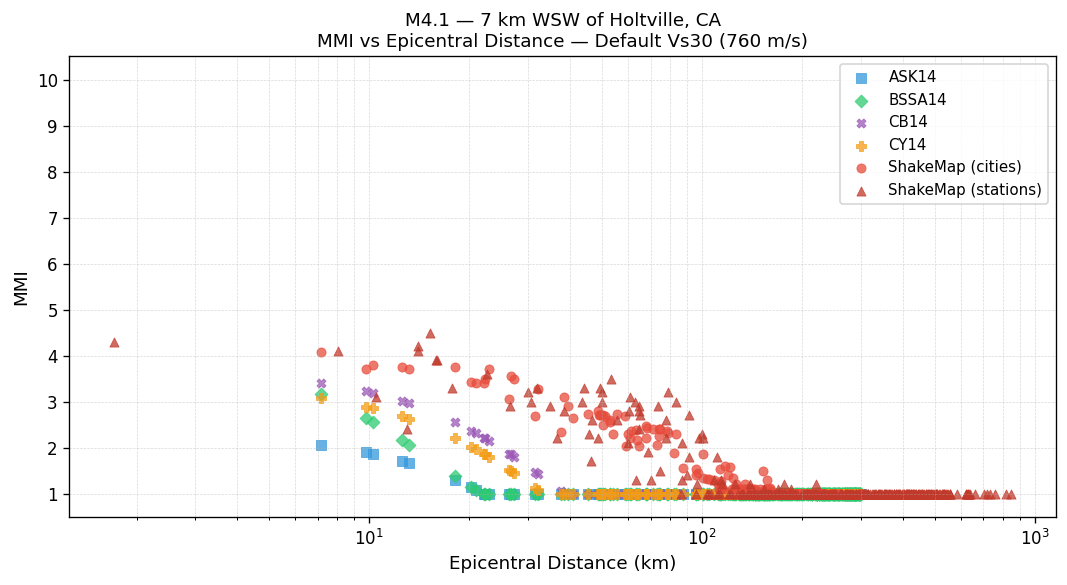
MMI vs Distance — Default Vs30 (760 m/s)
All methods using the 760 m/s rock-site reference. ShakeMap values are independent of Vs30.
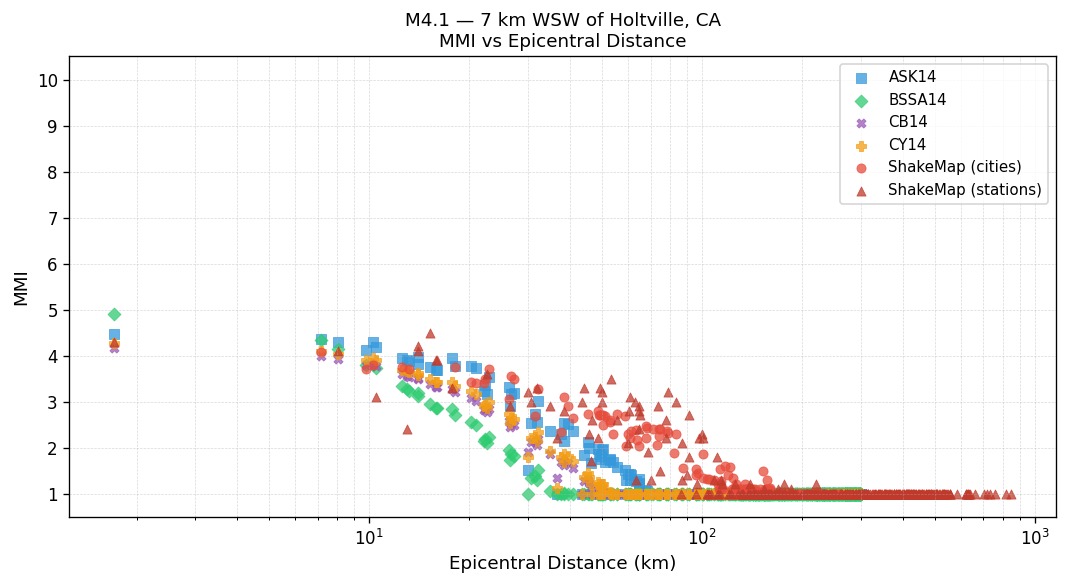
MMI vs Distance — Site-Specific Vs30
GMPEs use the site-specific Vs30 values shown in the table above. ShakeMap values are unchanged.
Peak Ground Motion Values — USGS ShakeMap
PGA and PGV interpolated from the USGS ShakeMap grid for this event. Values reflect ShakeMap's ground motion model, not GMPE estimates.
| Location | PGA (%g) | PGV (cm/s) |
|---|---|---|
|
Holtville
CA |
5.3436 | 1.742 |
|
Heber
CA |
4.6011 | 1.883 |
|
El Centro
CA |
3.7660 | 1.657 |