California · Oregon · Washington · Nevada · Idaho · Northern Mexico
Seismic Intensity, Place by Place
Magnitude describes the amount of energy released by the earthquake. Intensity describes the shaking at a place, and that is what matters when you decide what to do after the shaking stops.
For earthquakes of magnitude 3.5 or greater in our coverage region whose shaking reaches a named place, we post site-specific intensity lists and shaking reports. When shaking reaches MMI V (moderate) or higher, we also simulate ground motions at nearby cities and publish the simulated records, with animations driven by both simulated and recorded motion.
Our goal is intensity estimates for earthquakes everywhere. Our simulations cover this region, so we also collect camera footage of strong earthquakes around the world and rate each clip from the effects it shows. Shaking videos
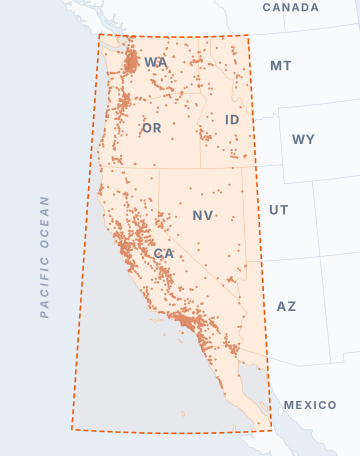
Recent seismic activity in our coverage region
16 events in the 30 days to 2026-10-05T20:22:30.510000Z · intensity reported for 13 of them.
Circle size shows magnitude; color shows the highest intensity estimated at any named place. Grey means no intensity report yet.
- M3.6 9 km 31 km SW of Dana Point, CA 2026-10-05T20:22:30.510000Z Weak(II)
- M3.8 10 km 4 km SE of Piru, CA 2026-09-30T03:00:27.240000Z Weak(III)
- M3.9 28 km 6 km WNW of Wauna, Washington 2026-09-29T21:05:56.250000Z Weak(III)
- M4.8 10 km 97 km W of Petrolia, CA 2026-09-29T11:36:37.910000Z Weak(II)
- M3.6 12 km 7 km WSW of Hermosa Beach, CA 2026-09-27T15:40:01.580000Z Weak(III)
- M4.1 6 km 20 km W of Preston, Nevada 2026-09-27T08:54:07.495000Z Weak(II)
Showing 6 of 13. See the rest →
What does intensity look like?
Intensity is defined by what shaking does. Real camera footage from earthquakes around the world, each clip rated from the effects it shows. Watch one and see what each level looks like.
 MMI VI
Clip of the day
MMI VI
Clip of the day
- •Heavy furniture moves
- •Unstable objects tip over
- •Building trembles
The intensity scale, observed and simulated

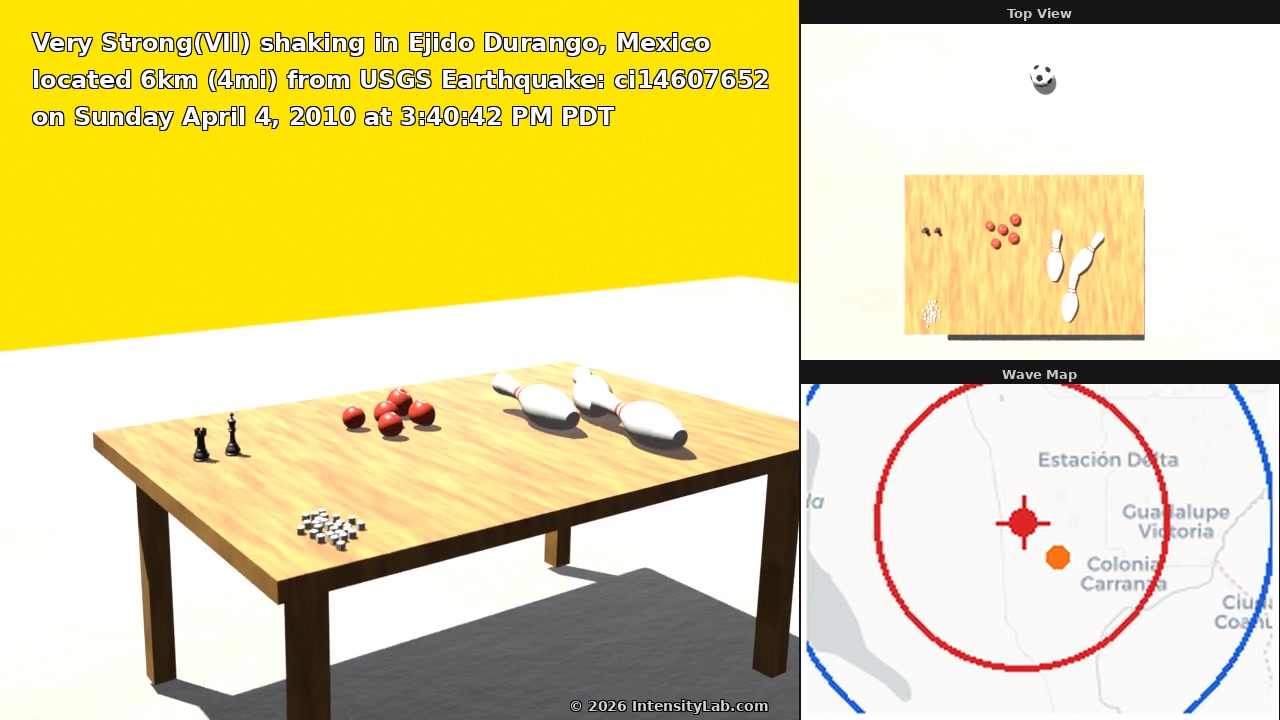



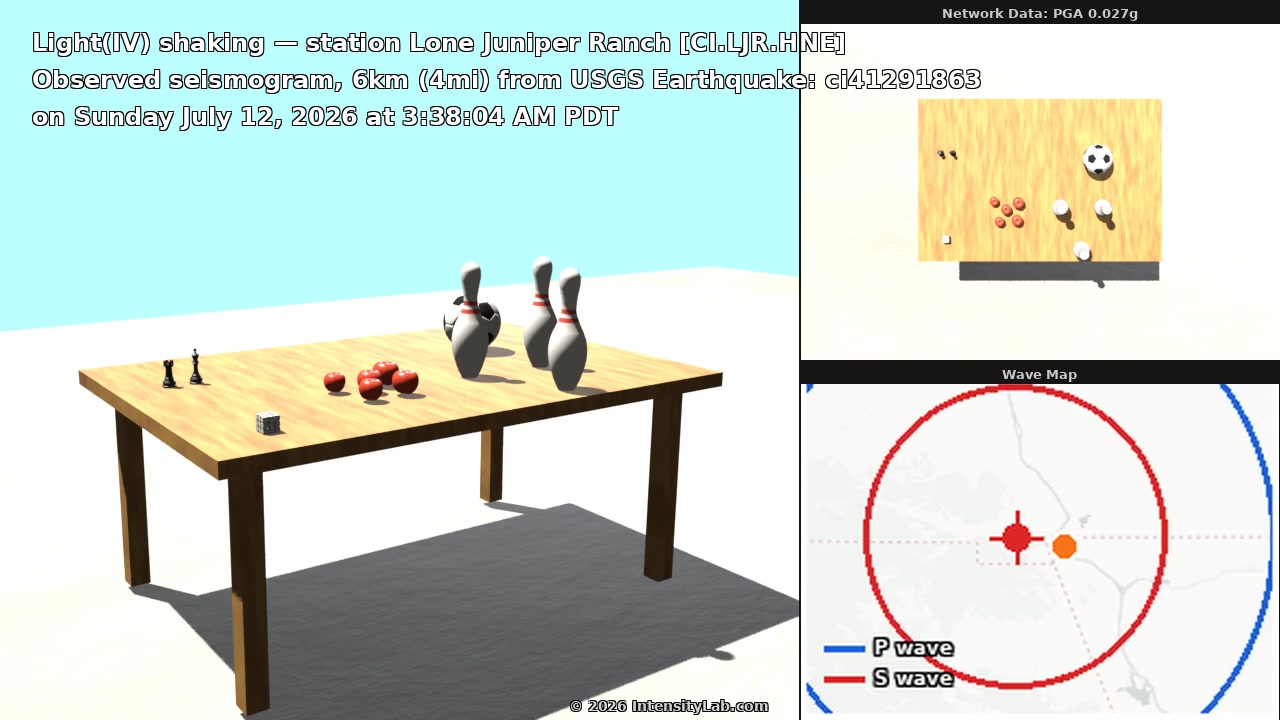
Recorded and simulated
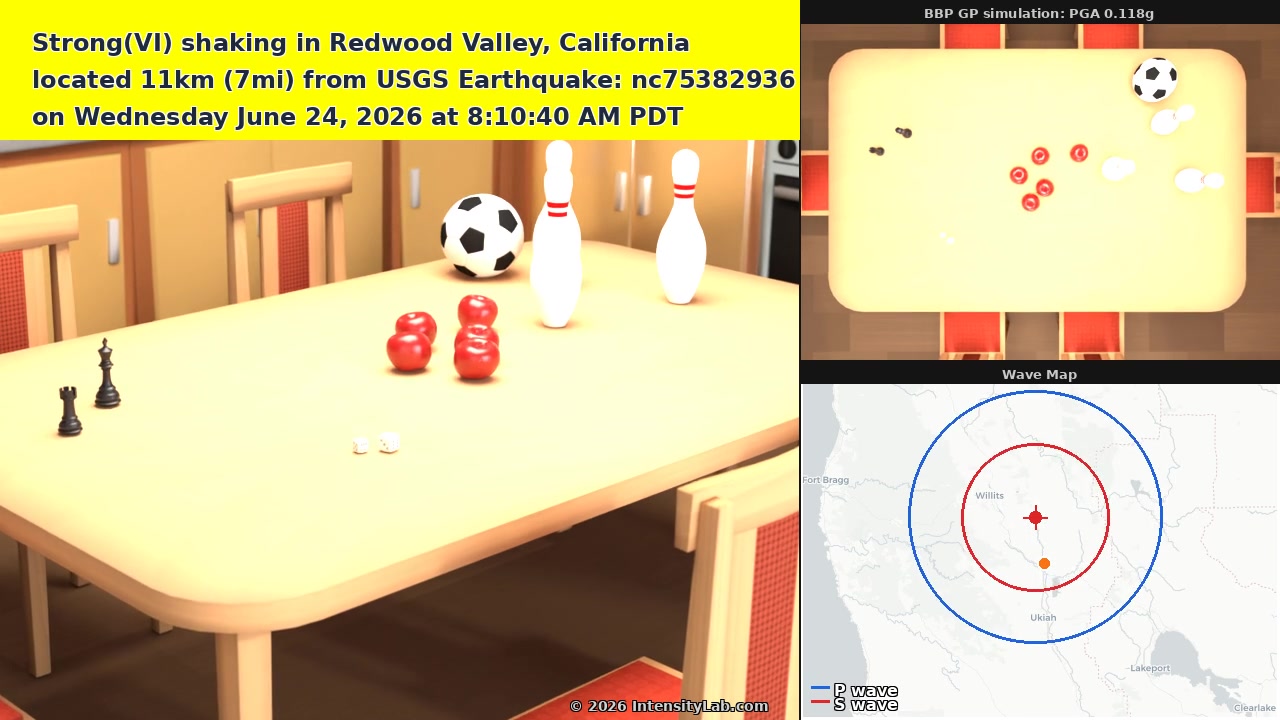
The same earthquake twice: water thrown about in real footage, and the juice jug in our Kitchen animation, shaken by the ground motion simulated for Redwood Valley.
 Recorded
MMI VII
Recorded
MMI VII
 Simulated
MMI VII
Simulated
MMI VII
Play them side by side → All comparisons → The full event report
About Seismic Intensities
Few people have felt strong shaking, so an intensity number is hard to picture. We turn each estimate into lists, reports, and videos that are accurate, visual, and easy to share, so that anyone can see what the shaking at a place was like. These are the formats we produce today, and we are adding more.
Available now
Six formats, produced automatically after each significant earthquakePopulation MMI List
Who felt what, by name: the estimated intensity at each named place the ShakeMap covers.
See the list → Event summarySeismic Station MMI List
Intensity computed from the ground motion each seismic station recorded: measured, not interpolated.
See the list → Site reportNearest Population Site Report
One place in depth: interpolated MMI, four NGA-West2 model estimates, site Vs30, and peak ground motion.
Read the report → Video · simulated motion (BBP)City Video (simulated)
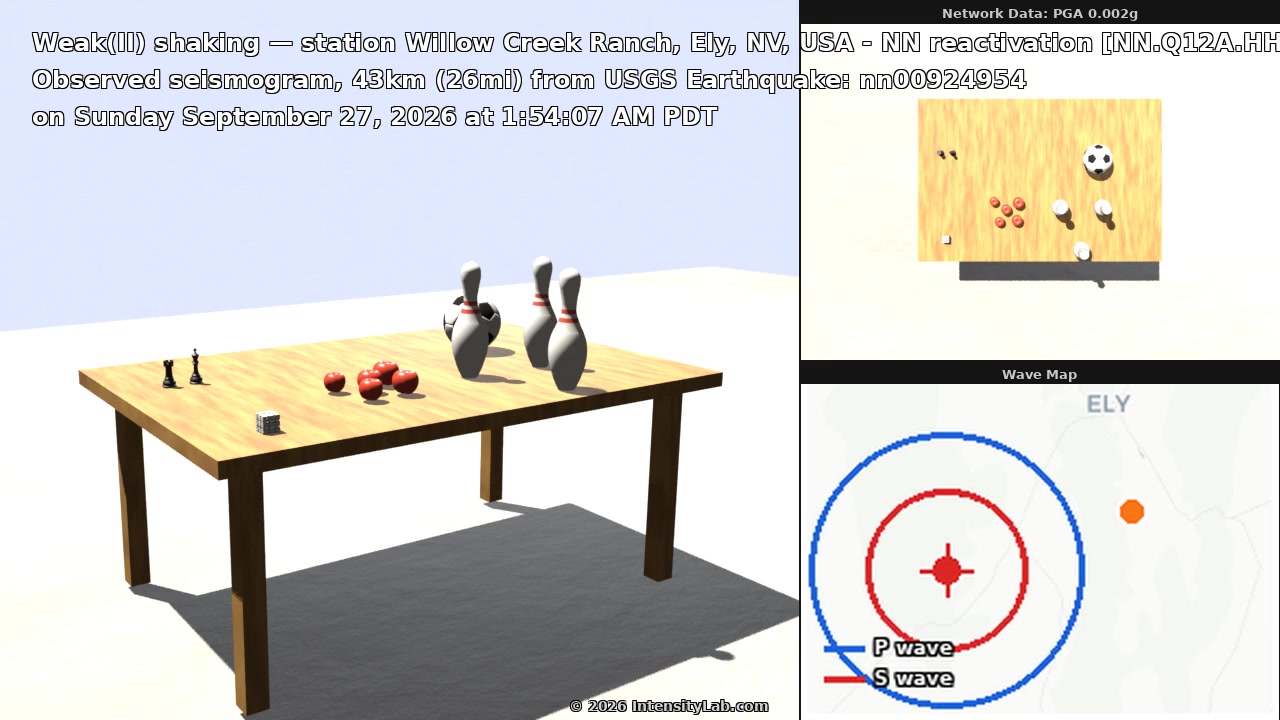
Everyday objects shaken by a physics-based seismogram, computed on the SCEC Broadband Platform for the nearest town.
Watch → Video · FDSN motionStation Video (observed)
The same scene driven by a real recording: a station waveform, corrected for the instrument and converted to displacement.
Watch → Video · simulated motion (BBP)Decay Video (simulated)
One earthquake at 5, 50, and 100 km, side by side, showing how quickly shaking weakens with distance.
Watch →Site last deployed: October 26, 2026.