Learn
Coverage & data
Which earthquakes we report on, the places we estimate intensity for, and the data and models behind the estimates.
Where we cover
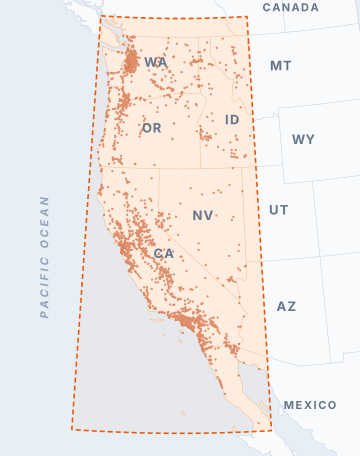
An earthquake is covered when three conditions hold:
- The USGS reports it at magnitude 3.5 or above.
- Its epicenter lies inside the coverage region, 28–50°N and 113–125°W.
- Its USGS ShakeMap reaches at least one of our 2,002 named places. An event offshore or across the Canadian border with no named place in its shaking footprint is not reported.
The named places are communities of roughly 1,000 or more residents, drawn from the GeoNames gazetteer: California (1,114), Washington (401), Oregon (220), northern Baja California and Sonora (101), western Idaho (100) and Nevada (66). Browse the places →
On each event page we list every place estimated at intensity IV or above, and always at least three. Animations are made for events whose strongest estimated shaking reaches intensity V.
What it runs on
Intensity Lab computes Modified Mercalli Intensity (MMI) estimates. Observed shaking comes from USGS ShakeMap, with independent estimates from four NGA-West2 ground motion models computed with GEM OpenQuake. Site conditions come from the SCEC Unified Community Velocity Model, and the simulated seismograms behind the animations are computed on the SCEC Broadband Platform through the BBP Services API.