Max Est. MMI
18 km WSW of Johannesburg, CA
Ground Shaking Intensities — Interpolated ShakeMap MMI
3 sites| Location | MMI Description |
|---|---|
|
California City
CA |
Weak(III) |
|
North Edwards
CA |
Weak(II) |
|
Boron
CA |
Weak(II) |
Seismic Station Observed MMI
MMI values are derived directly from observed ground motion measurements at seismic stations and are not spatially interpolated.
| Station | MMI Description |
|---|---|
| Desert Tortoise Park (CI.DTP) | Weak(III) |
| Red Rock Canyon State Park (CI.RRC) | Weak(III) |
| Laurel Mtn (CI.LRL) | Weak(III) |
Engineering Ground Motion Parameters
GMPE predictions provide an independent check on the ShakeMap interpolated intensities above.
ShakeMap relies on seismic station recordings; in areas with sparse station coverage — or
for large teleseismic events and earthquakes outside dense West Coast networks — ShakeMap
MMI can be inaccurate. A significant difference between ShakeMap and GMPE estimates is a signal
that the ShakeMap result should be treated as preliminary.
Also includes site Vs30 values and raw ground motion parameters (PGA/PGV).
Show ▼
Engineering Ground Motion Parameters
GMPE predictions provide an independent check on the ShakeMap interpolated intensities above. ShakeMap relies on seismic station recordings; in areas with sparse station coverage — or for large teleseismic events and earthquakes outside dense West Coast networks — ShakeMap MMI can be inaccurate. A significant difference between ShakeMap and GMPE estimates is a signal that the ShakeMap result should be treated as preliminary. Also includes site Vs30 values and raw ground motion parameters (PGA/PGV).
Est. Vs30 Values
Estimated shear-wave velocity in the upper 30 m used in GMPE calculations. Ref. column shows the 760 m/s rock-site reference for comparison.
| Location | Ref. (760 m/s) | Est. Vs30 (m/s) |
|---|---|---|
|
California City
CA |
760 | 294 |
|
North Edwards
CA |
760 | 228 |
|
Boron
CA |
760 | 294 |
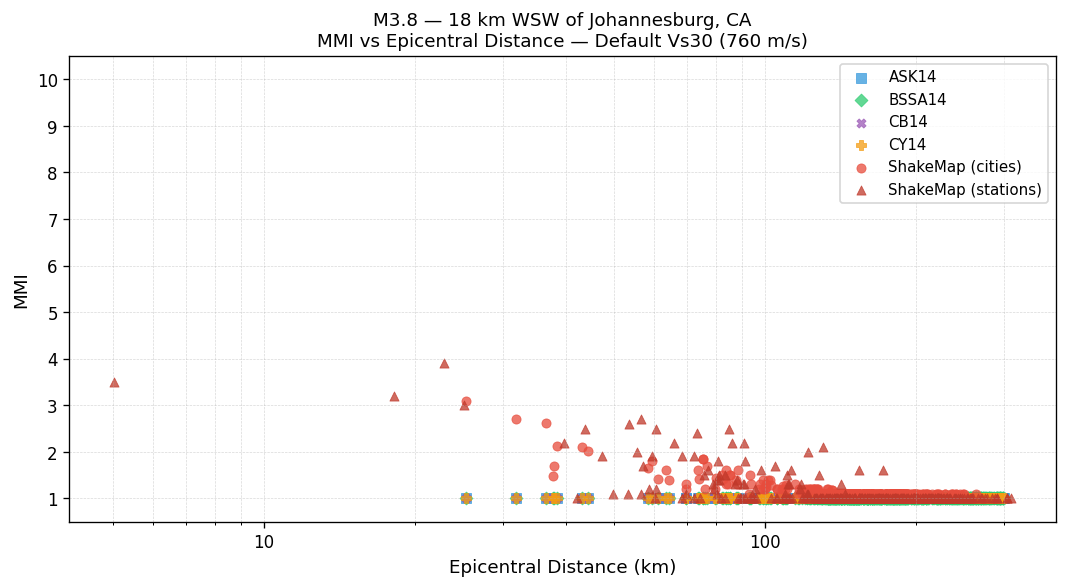
MMI vs Distance — Default Vs30 (760 m/s)
All methods using the 760 m/s rock-site reference. ShakeMap values are independent of Vs30.
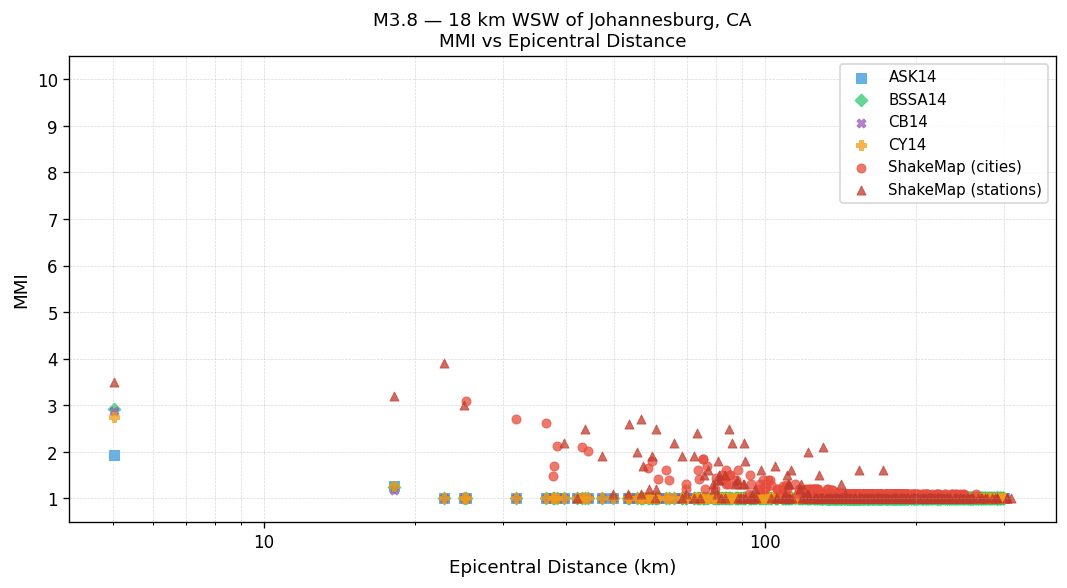
MMI vs Distance — Est. Vs30
GMPEs use the Est. Vs30 values shown in the table above. ShakeMap values are independent of Vs30.
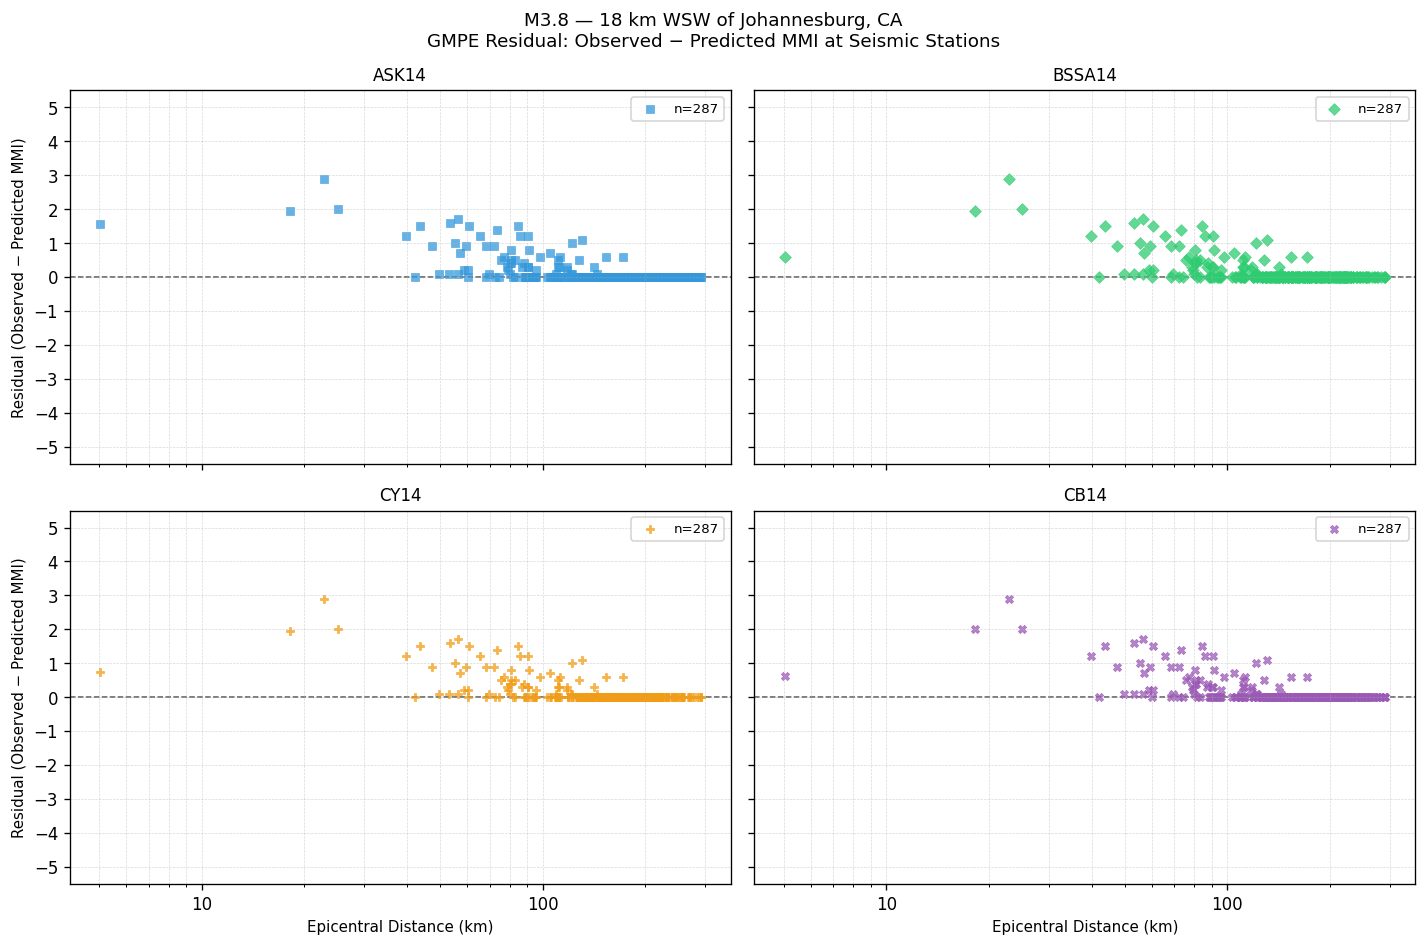
GMPE Residual — Observed − Predicted MMI
Signed residual at each seismic station. Positive values mean the GMPE underestimated shaking; negative values mean it overestimated. The dashed line at zero indicates perfect agreement.
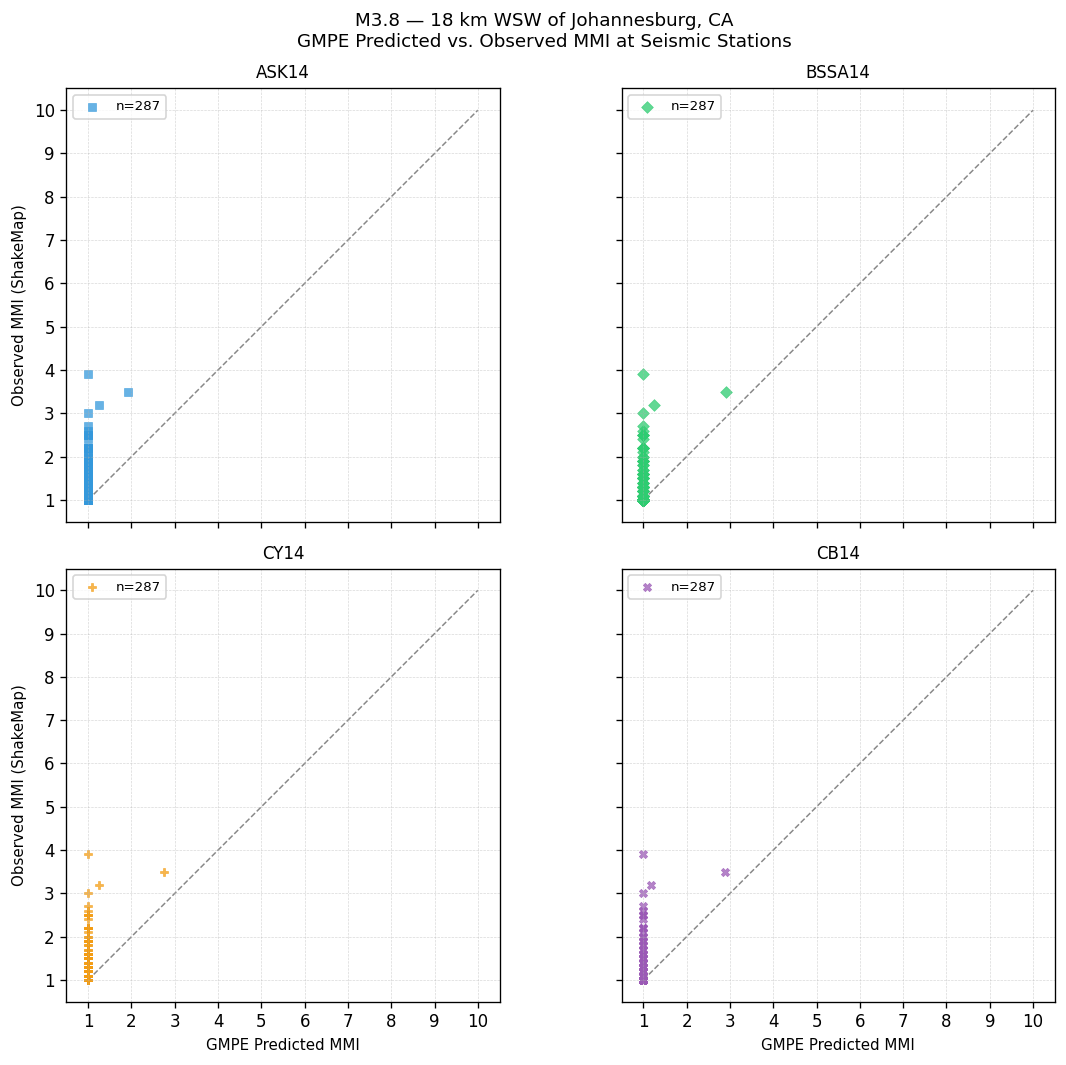
GMPE Predicted vs. Observed MMI at Seismic Stations
Each point is one seismic station. Points on the dashed 1:1 line indicate perfect agreement; above the line = GMPE underestimated shaking; below = overestimated.
GMPE Performance — Station Observations
Statistics computed by comparing each GMPE's predicted MMI against ShakeMap observed MMI at seismic stations. Bias = mean(observed − predicted). Lower RMSE indicates better overall agreement with instrumental measurements.
| GMPE | Bias | Sigma | RMSE |
|---|---|---|---|
| ASK14 | +0.15 | 0.40 | 0.42 |
| BSSA14 | +0.15 | 0.39 | 0.42 |
| CY14 | +0.15 | 0.39 | 0.42 |
| CB14 | +0.15 | 0.39 | 0.42 |
Peak Ground Motion — Seismic Station Observations
Recorded PGA and PGV at seismic stations, sorted by highest PGA. Top 25 stations shown. MMI (PGA) and MMI (PGV) are independent conversions via Worden et al. (2012) GMICE.
| Station | PGA (g) | MMI (PGA) | PGV (cm/s) | MMI (PGV) |
|---|---|---|---|---|
| Laurel Mtn (CI.LRL) | 0.0452 | Light(IV) | 0.851 | Light(IV) |
| Desert Tortoise Park (CI.DTP) | 0.0303 | Light(IV) | 0.438 | Weak(III) |
| Nine Mile Canyon (CI.WNM) | 0.0092 | Weak(II) | 0.102 | Weak(II) |
| Red Rock Canyon State Park (CI.RRC) | 0.0089 | Weak(II) | 0.299 | Weak(III) |
| Tower 2 (CI.TOW2) | 0.0056 | Not felt(I) | 0.142 | Weak(II) |
| Fish Rocks (CI.FSR) | 0.0056 | Not felt(I) | 0.119 | Weak(II) |
| California City Airport (CI.CCA) | 0.0047 | Not felt(I) | 0.199 | Weak(II) |
| Renegade Canyon (CI.WRC2) | 0.0032 | Not felt(I) | 0.084 | Weak(II) |
| Snort (CI.SRT) | 0.0032 | Not felt(I) | 0.100 | Weak(II) |
| Volcano Peak 2 (CI.WVP2) | 0.0028 | Not felt(I) | 0.045 | Not felt(I) |
| Haiwee, Pumping Plant (NP.1809) | 0.0028 | Not felt(I) | 0.065 | Weak(II) |
| Coso Hot Springs 2 (CI.WCS2) | 0.0025 | Not felt(I) | 0.042 | Not felt(I) |
| Bear Peak (CI.WBP) | 0.0024 | Not felt(I) | 0.047 | Not felt(I) |
| Hanning Flat (CI.WHF) | 0.0022 | Not felt(I) | 0.064 | Weak(II) |
| Rodman Mountain (CI.RMM) | 0.0021 | Not felt(I) | 0.058 | Weak(II) |
| Cattani Ranch (CI.TEH) | 0.0021 | Not felt(I) | 0.050 | Not felt(I) |
| Bird Springs (CI.WBS) | 0.0019 | Not felt(I) | 0.062 | Weak(II) |
| Edwards 2 (CI.EDW2) | 0.0018 | Not felt(I) | 0.019 | Not felt(I) |
| Onyx Ranch (CI.WOR) | 0.0016 | Not felt(I) | 0.021 | Not felt(I) |
| Leduc Ranch (CI.LDR) | 0.0016 | Not felt(I) | 0.043 | Not felt(I) |
| Joshua Ridge: China Lake (CI.JRC2) | 0.0016 | Not felt(I) | 0.030 | Not felt(I) |
| Kern River P P #3 (CI.KRV3) | 0.0016 | Not felt(I) | 0.032 | Not felt(I) |
| Rio Hondo (CI.RIO) | 0.0014 | Not felt(I) | 0.010 | Not felt(I) |
| Christmas Canyon China Lake (CI.CCC) | 0.0014 | Not felt(I) | 0.046 | Not felt(I) |
| Searles Valley (CI.SEV) | 0.0012 | Not felt(I) | 0.036 | Not felt(I) |