Max Est. MMI
18 km WSW of Johannesburg, CA
Ground Shaking Intensities — Interpolated ShakeMap MMI
3 sites| Location | MMI Description |
|---|---|
|
California City
CA |
Weak(II) |
|
North Edwards
CA |
Not felt(I) |
|
Boron
CA |
Not felt(I) |
Seismic Station Observed MMI
MMI values are derived directly from observed ground motion measurements at seismic stations and are not spatially interpolated.
| Station | MMI Description |
|---|---|
| California City Airport (CI.CCA) | Weak(II) |
| Christmas Canyon China Lake (CI.CCC) | Not felt(I) |
| Barstow (CI.BAW) | Not felt(I) |
Engineering Ground Motion Parameters
GMPE predictions provide an independent check on the ShakeMap interpolated intensities above.
ShakeMap relies on seismic station recordings; in areas with sparse station coverage — or
for large teleseismic events and earthquakes outside dense West Coast networks — ShakeMap
MMI can be inaccurate. A significant difference between ShakeMap and GMPE estimates is a signal
that the ShakeMap result should be treated as preliminary.
Also includes site Vs30 values and raw ground motion parameters (PGA/PGV).
Show ▼
Engineering Ground Motion Parameters
GMPE predictions provide an independent check on the ShakeMap interpolated intensities above. ShakeMap relies on seismic station recordings; in areas with sparse station coverage — or for large teleseismic events and earthquakes outside dense West Coast networks — ShakeMap MMI can be inaccurate. A significant difference between ShakeMap and GMPE estimates is a signal that the ShakeMap result should be treated as preliminary. Also includes site Vs30 values and raw ground motion parameters (PGA/PGV).
Est. Vs30 Values
Estimated shear-wave velocity in the upper 30 m used in GMPE calculations. Ref. column shows the 760 m/s rock-site reference for comparison.
| Location | Ref. (760 m/s) | Est. Vs30 (m/s) |
|---|---|---|
|
California City
CA |
760 | 294 |
|
North Edwards
CA |
760 | 228 |
|
Boron
CA |
760 | 294 |
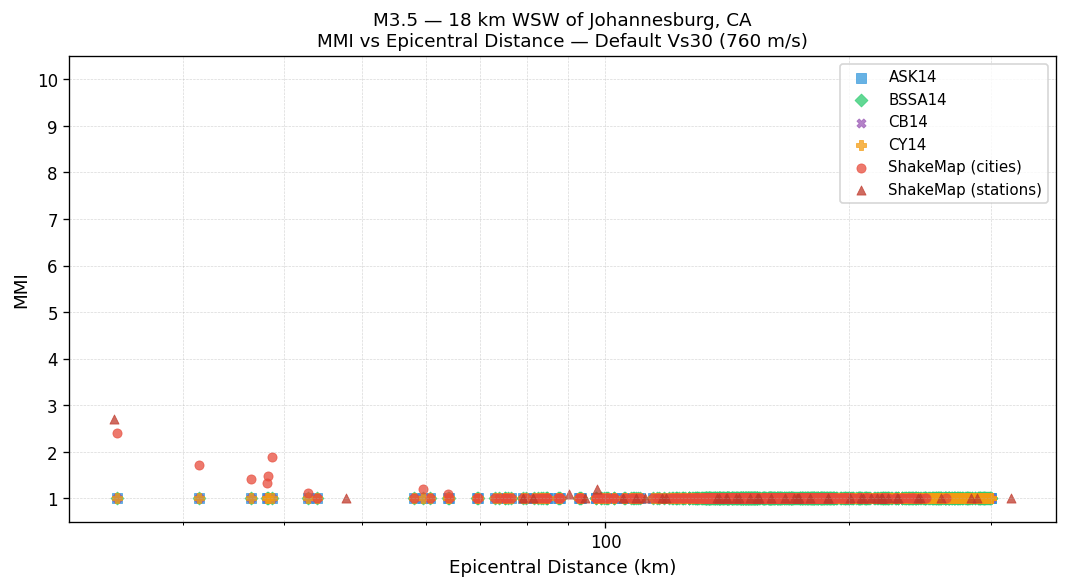
MMI vs Distance — Default Vs30 (760 m/s)
All methods using the 760 m/s rock-site reference. ShakeMap values are independent of Vs30.
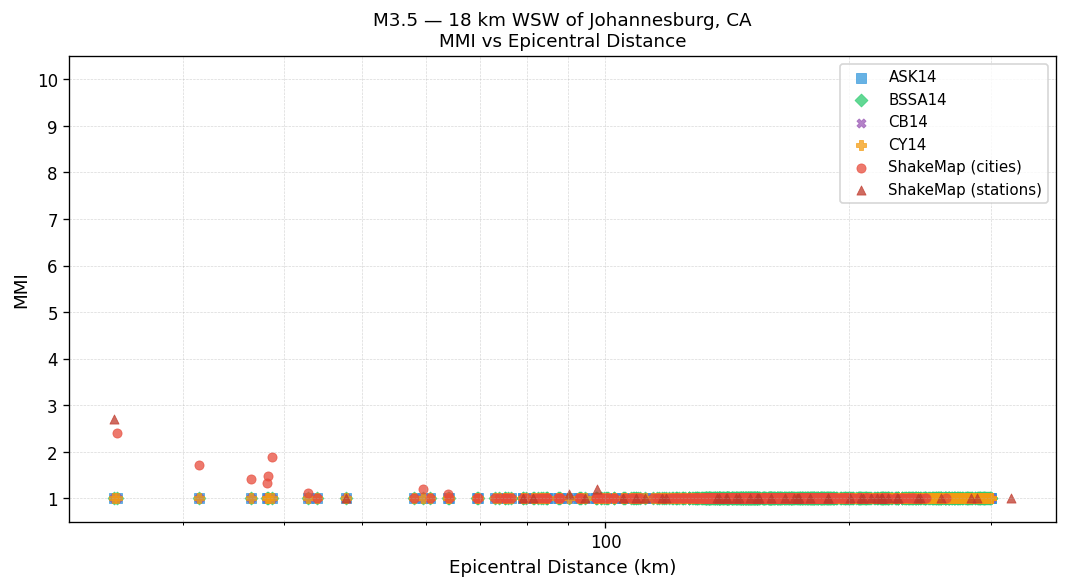
MMI vs Distance — Est. Vs30
GMPEs use the Est. Vs30 values shown in the table above. ShakeMap values are independent of Vs30.
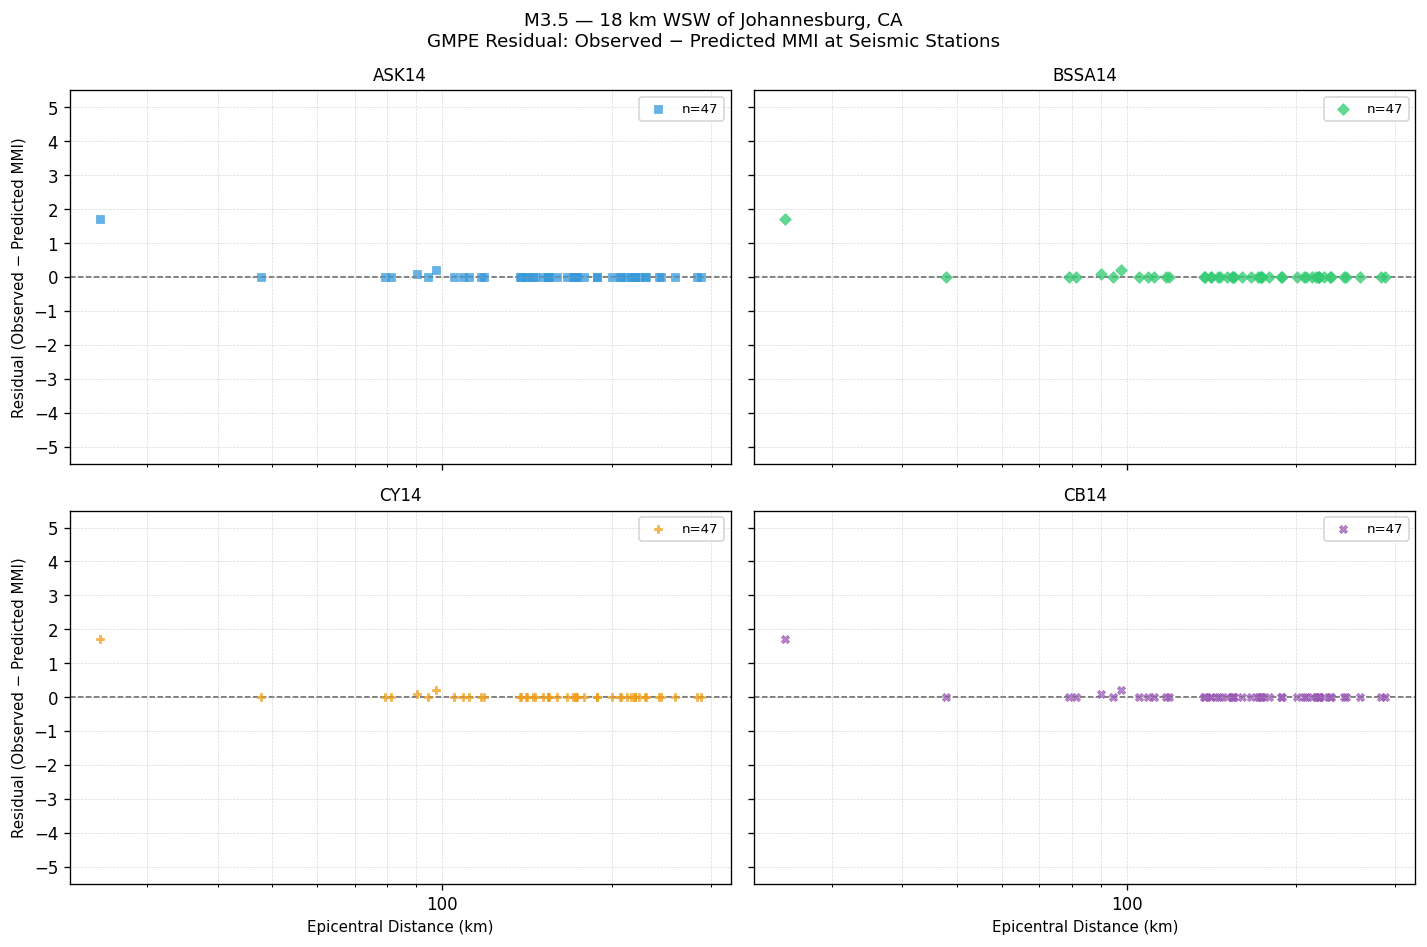
GMPE Residual — Observed − Predicted MMI
Signed residual at each seismic station. Positive values mean the GMPE underestimated shaking; negative values mean it overestimated. The dashed line at zero indicates perfect agreement.
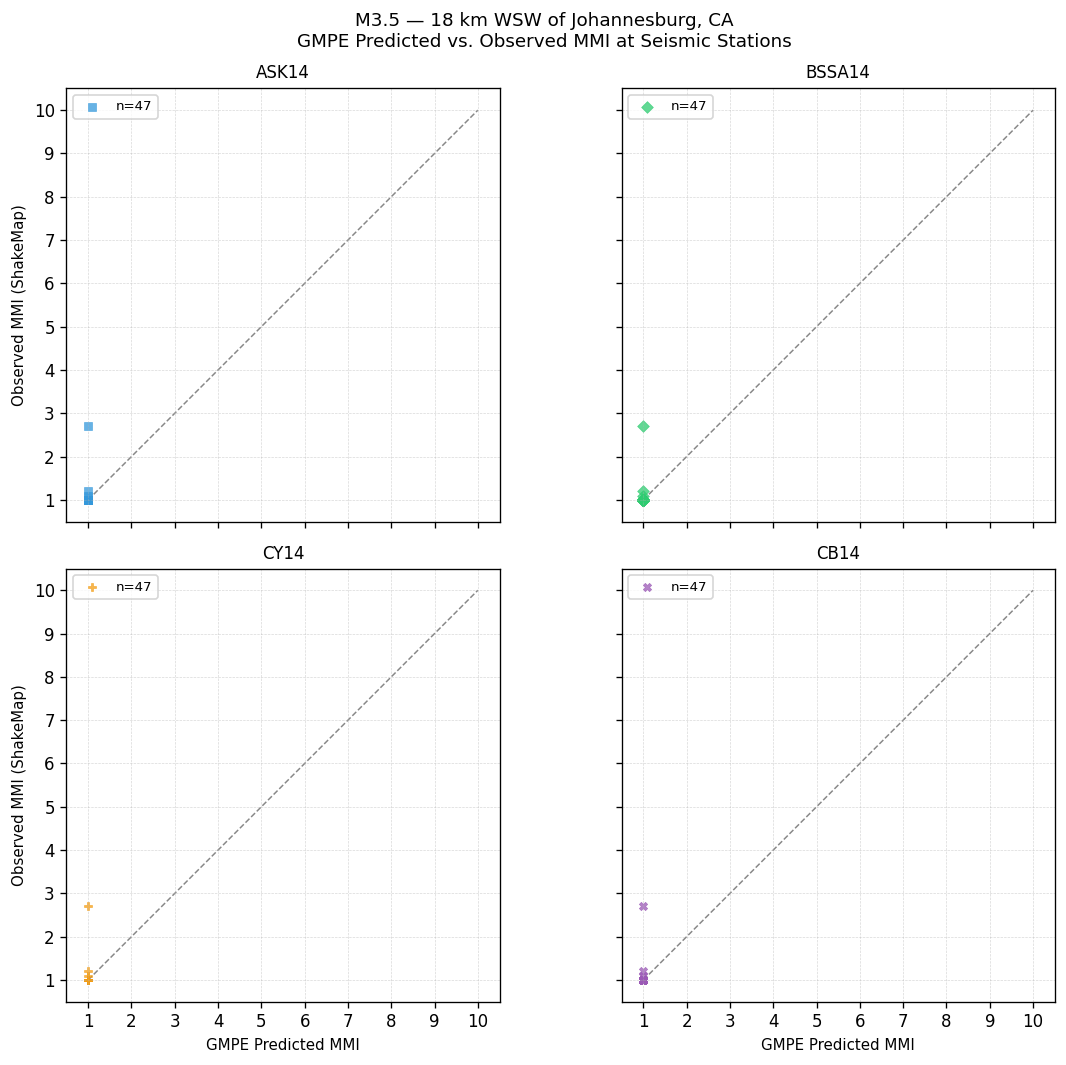
GMPE Predicted vs. Observed MMI at Seismic Stations
Each point is one seismic station. Points on the dashed 1:1 line indicate perfect agreement; above the line = GMPE underestimated shaking; below = overestimated.
GMPE Performance — Station Observations
Statistics computed by comparing each GMPE's predicted MMI against ShakeMap observed MMI at seismic stations. Bias = mean(observed − predicted). Lower RMSE indicates better overall agreement with instrumental measurements.
| GMPE | Bias | Sigma | RMSE |
|---|---|---|---|
| ASK14 | +0.04 | 0.25 | 0.25 |
| BSSA14 | +0.04 | 0.25 | 0.25 |
| CY14 | +0.04 | 0.25 | 0.25 |
| CB14 | +0.04 | 0.25 | 0.25 |
Peak Ground Motion — Seismic Station Observations
Recorded PGA and PGV at seismic stations, sorted by highest PGA. Top 25 stations shown. MMI (PGA) and MMI (PGV) are independent conversions via Worden et al. (2012) GMICE.
| Station | PGA (g) | MMI (PGA) | PGV (cm/s) | MMI (PGV) |
|---|---|---|---|---|
| California City Airport (CI.CCA) | 0.0038 | Not felt(I) | 0.116 | Weak(II) |
| Oxnard (CE.25325) | 0.0009 | Not felt(I) | 0.007 | Not felt(I) |
| Adelanto Receiving (CI.ADO) | 0.0008 | Not felt(I) | 0.018 | Not felt(I) |
| Burnt Peak (CI.BTP) | 0.0007 | Not felt(I) | 0.019 | Not felt(I) |
| Big Bear Solar Observatory (CI.BBR) | 0.0003 | Not felt(I) | 0.008 | Not felt(I) |
| Channel Island (CI.CHI) | 0.0003 | Not felt(I) | 0.004 | Not felt(I) |
| Antelope (CI.ALP) | 0.0003 | Not felt(I) | 0.006 | Not felt(I) |
| Barstow (CI.BAW) | 0.0003 | Not felt(I) | 0.007 | Not felt(I) |
| Christmas Canyon China Lake (CI.CCC) | 0.0003 | Not felt(I) | 0.008 | Not felt(I) |
| Maricopa Array No 3 (NP.1043) | 0.0002 | Not felt(I) | 0.006 | Not felt(I) |
| Alvord Mountain (CI.AVM) | 0.0002 | Not felt(I) | 0.007 | Not felt(I) |
| Chilao Flat Rngr Sta (CI.CHF) | 0.0002 | Not felt(I) | 0.004 | Not felt(I) |
| Mt. Baldy Ranger Station (CI.BFS) | 0.0002 | Not felt(I) | 0.003 | Not felt(I) |
| Cal Citrus State Park (CI.CCT) | 0.0002 | Not felt(I) | 0.006 | Not felt(I) |
| Beaumont Base (CI.BBS) | 0.0002 | Not felt(I) | 0.002 | Not felt(I) |
| Butler Peak 2 (CI.BTL2) | 0.0002 | Not felt(I) | 0.005 | Not felt(I) |
| Bailey (CI.BAI) | 0.0001 | Not felt(I) | 0.004 | Not felt(I) |
| Barre (CI.BRE) | 0.0001 | Not felt(I) | 0.002 | Not felt(I) |
| Chino Hills State Park (CI.CHL) | 0.0001 | Not felt(I) | 0.003 | Not felt(I) |
| Crafton Hills (CI.CFT) | 0.0001 | Not felt(I) | 0.003 | Not felt(I) |
| Baldwin Hills (CI.BHP) | 0.0001 | Not felt(I) | 0.003 | Not felt(I) |
| Black Canyon (CI.BLC) | 0.0001 | Not felt(I) | 0.003 | Not felt(I) |
| Chino (CI.CHN) | 0.0001 | Not felt(I) | 0.003 | Not felt(I) |
| Camp Hess Kramer (CI.CHK) | 0.0001 | Not felt(I) | 0.002 | Not felt(I) |
| Calstate Bakersfield (CI.BAK) | 0.0001 | Not felt(I) | 0.004 | Not felt(I) |