Observed vs Simulated — Goodness of Fit
A physics-based simulation of this earthquake, compared against the seismograms the network actually recorded. M6.4 15km WSW of Ferndale, CA · 2022-12-20 10:34:24 UTC
Before reading the result
What this measurement does and does not establish.
Emulated hardware. The simulation ran on arm64 under emulation. Amplitudes are not SCEC-reference-accurate, and this measurement cannot separate the platform from the model.
Velocity model. Simulated with NoCal500. No installed region is native to this epicentre, so the crustal profile is an approximation.
One realization. A single stochastic rupture, not an ensemble. The bias below is one draw; a second run with a different seed would give a different number.
Defaulted Vs30 at 4 of 31 sites. Those sites were simulated with a Vs30 value repeated across three or more stations — a lookup default rather than a site measurement. Vs30 drives the site term, so a defaulted value produces bias at intermediate and long period that is not the model's fault.
What a pass means. Consistency with recordings at these 31 stations, for this event, under this velocity model, on this hardware, within a factor of 1.99. It is not a general statement about BBP and not a prediction of accuracy at an unrecorded site.
Result
- mean |bias|
- 0.165
- a factor of 1.18×
- pass band
- 0.69
- a factor of 1.99×, declared before the run
- sigma
- 1.244
- station-to-station scatter
- cross-check
- 0.327
- recomputed here from the waveforms
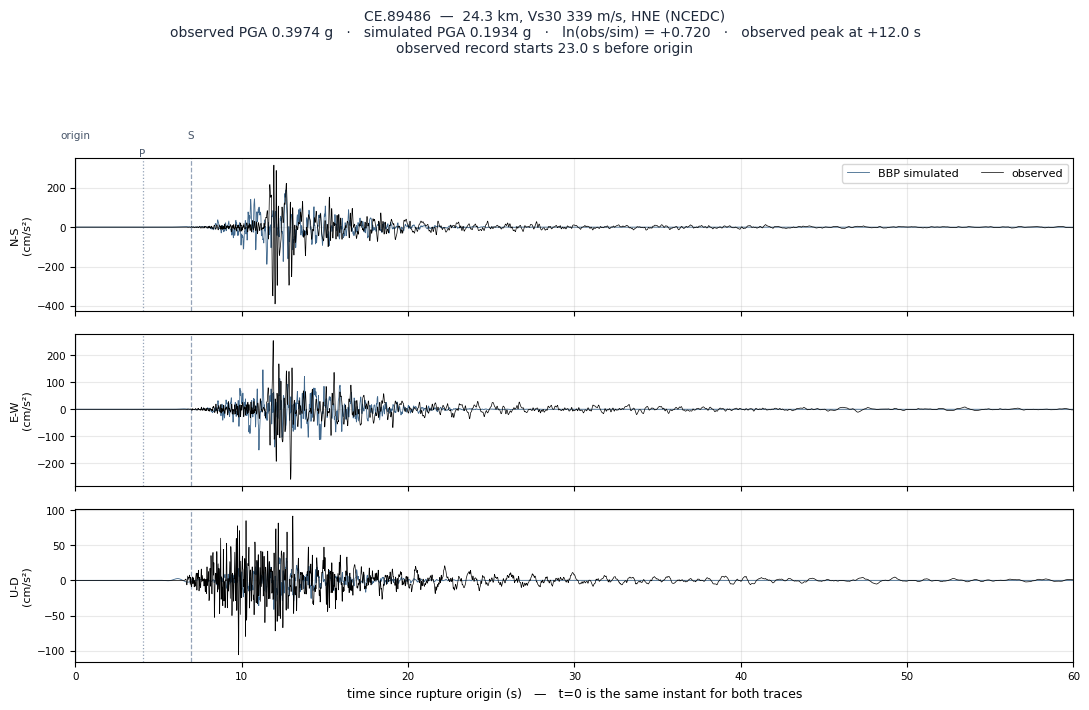
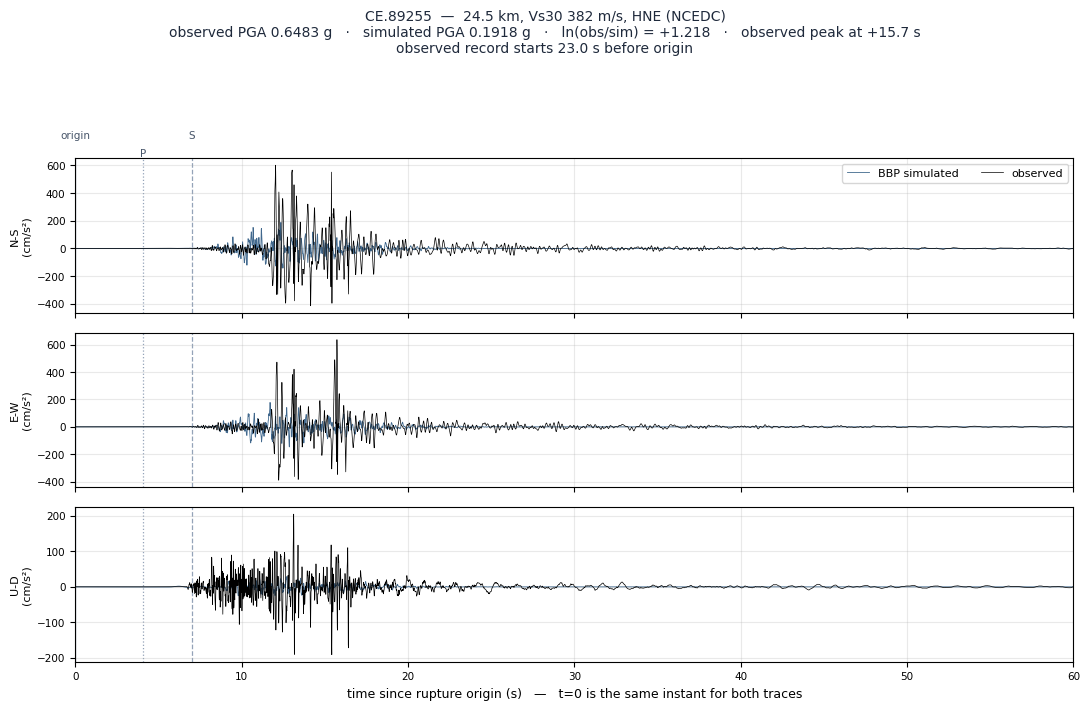
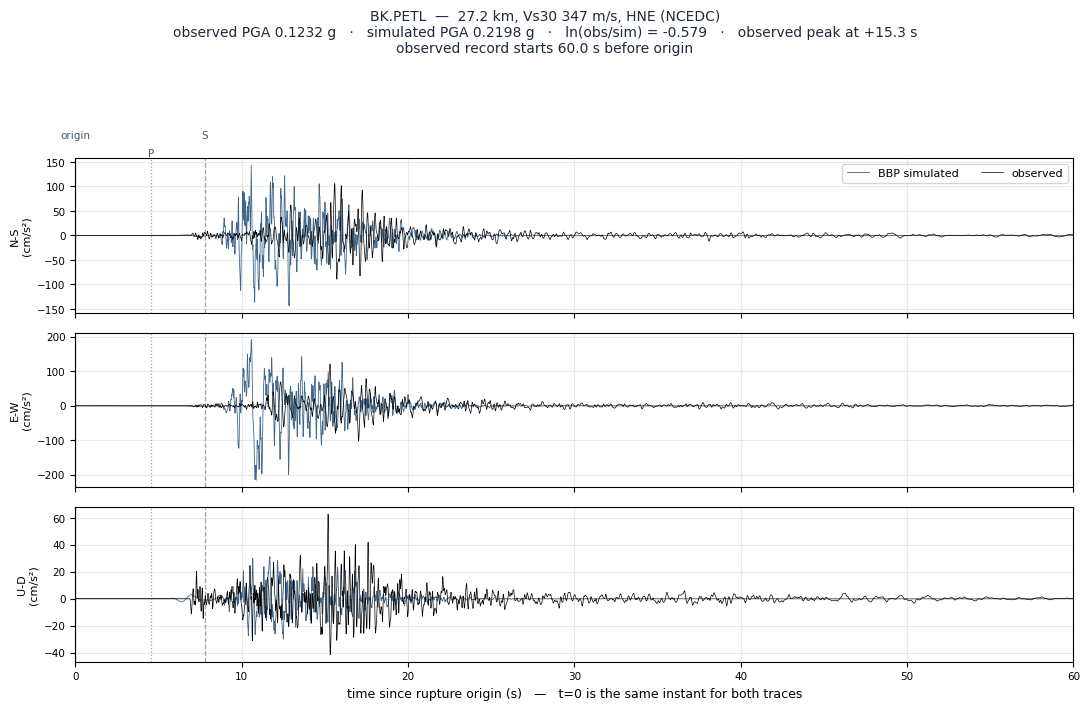
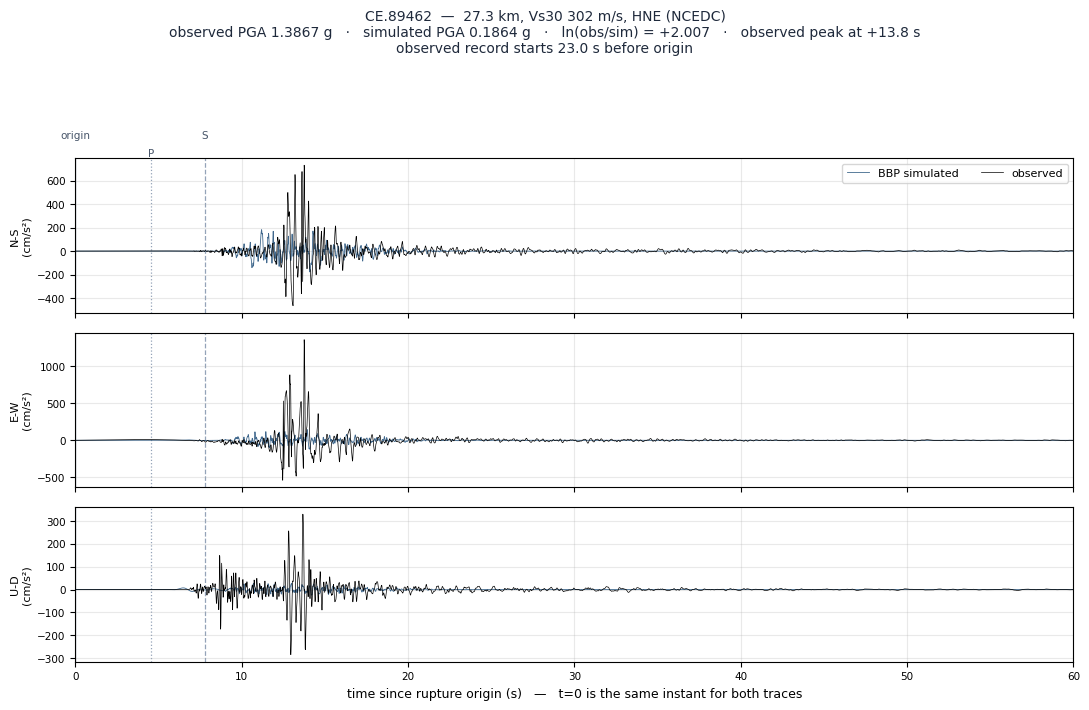
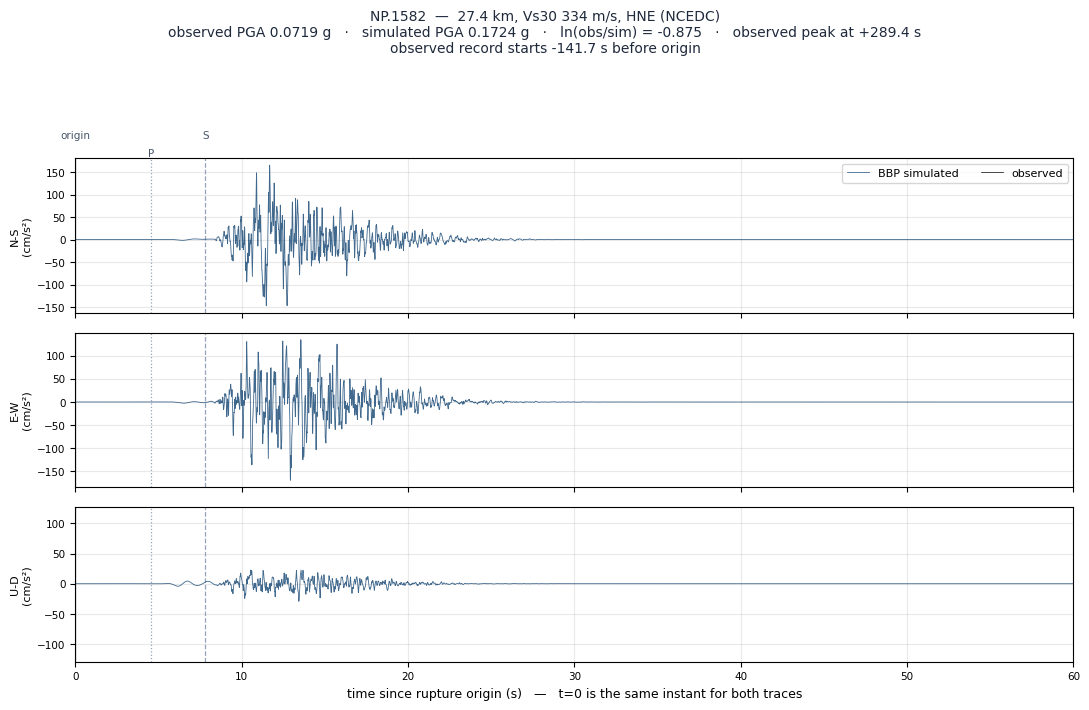
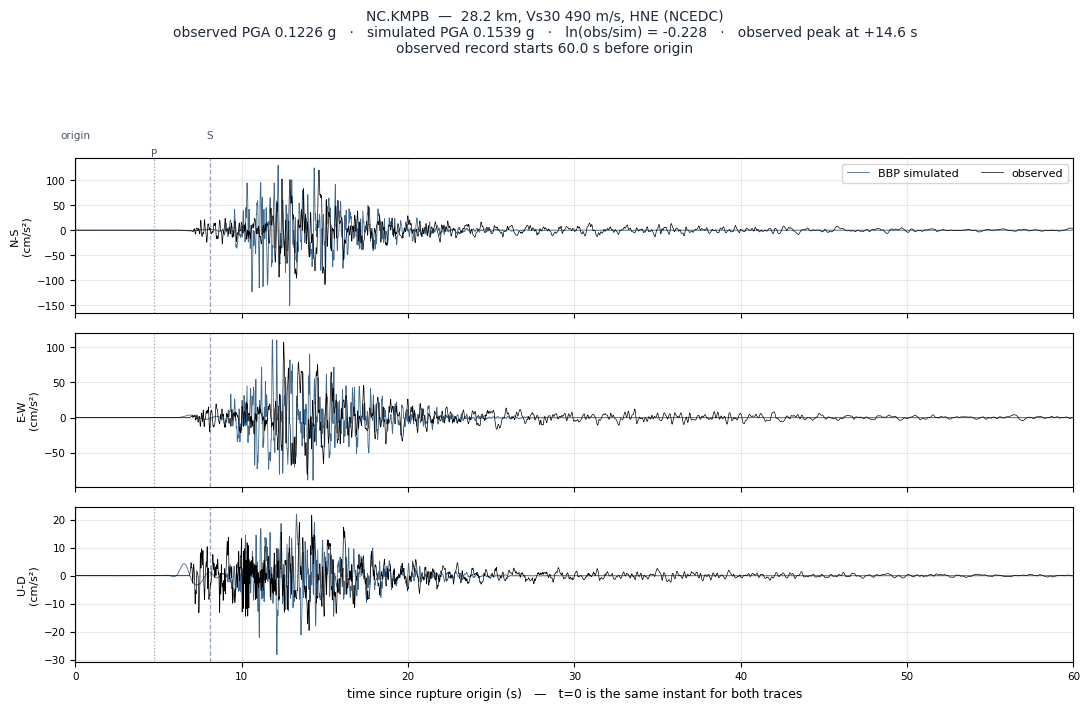
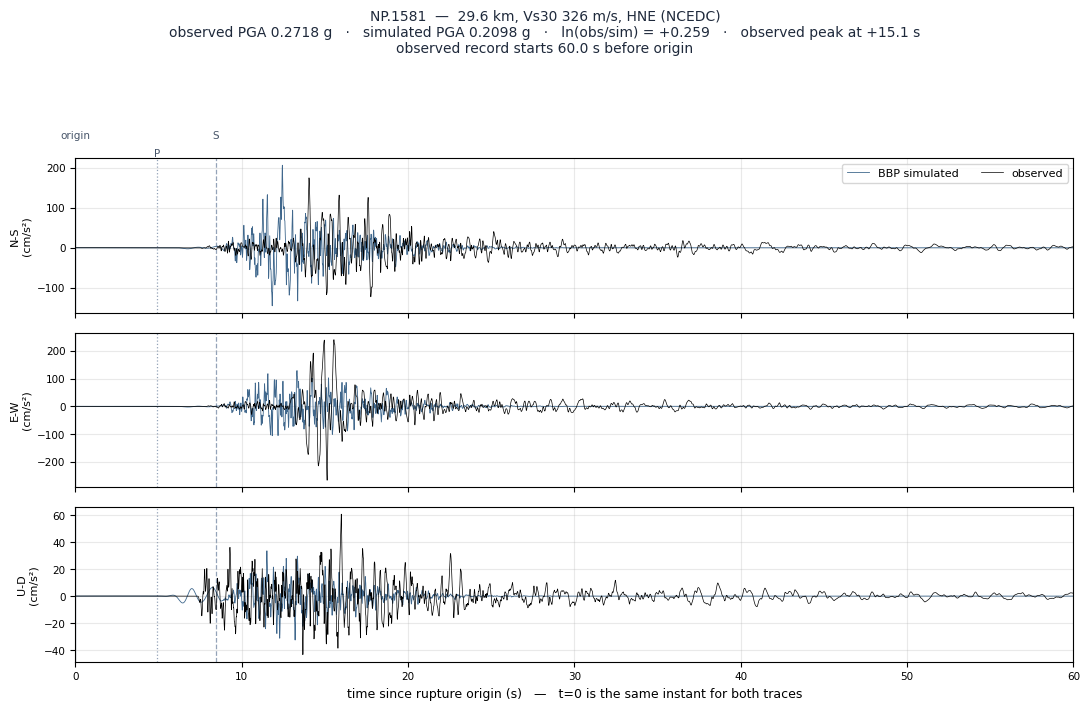
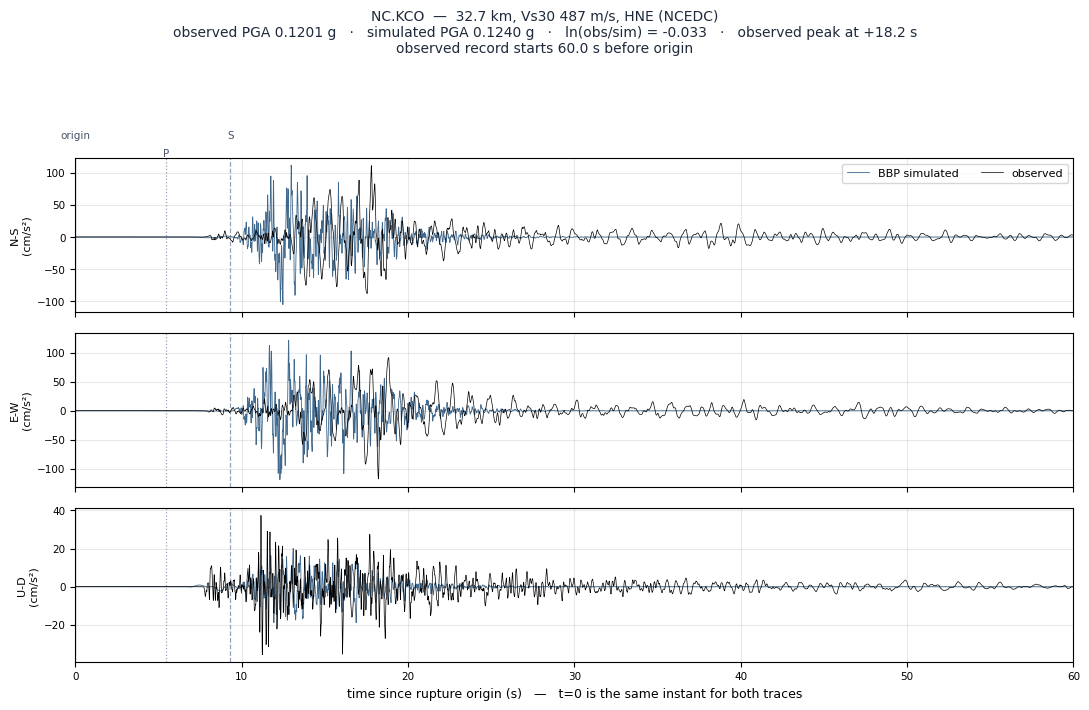
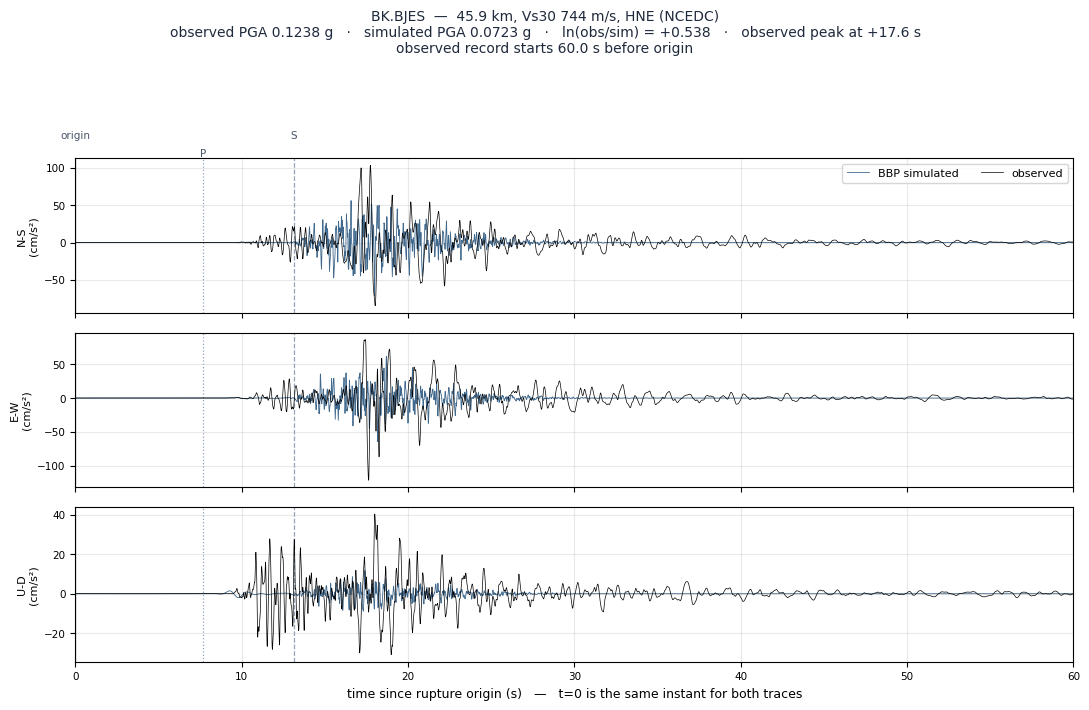
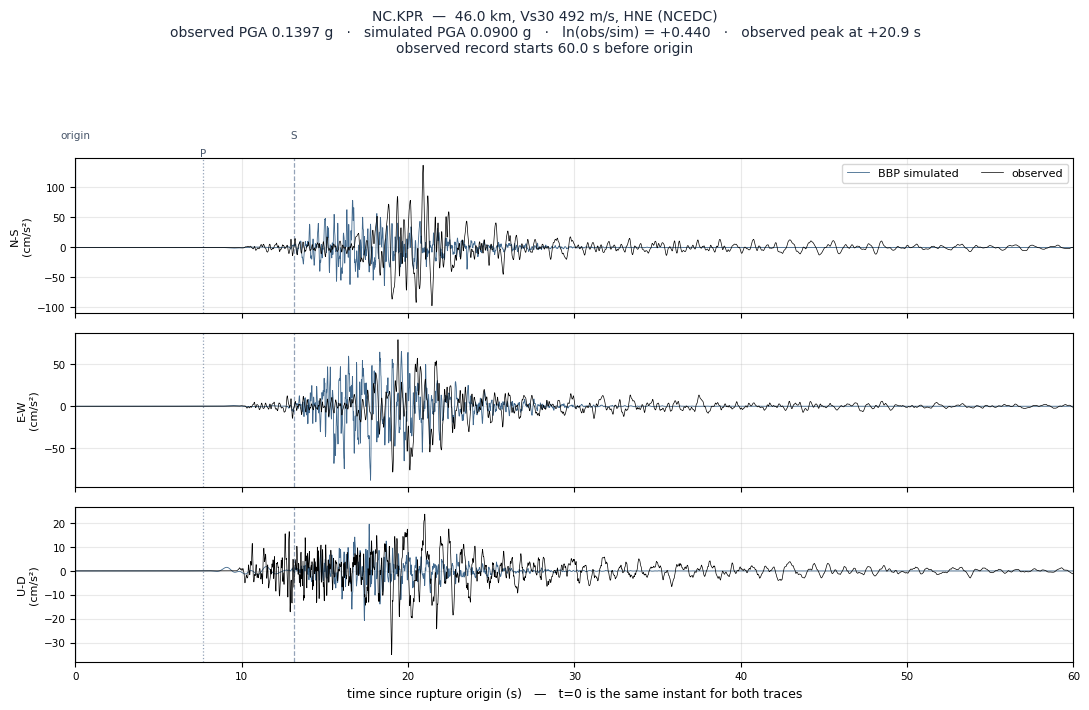
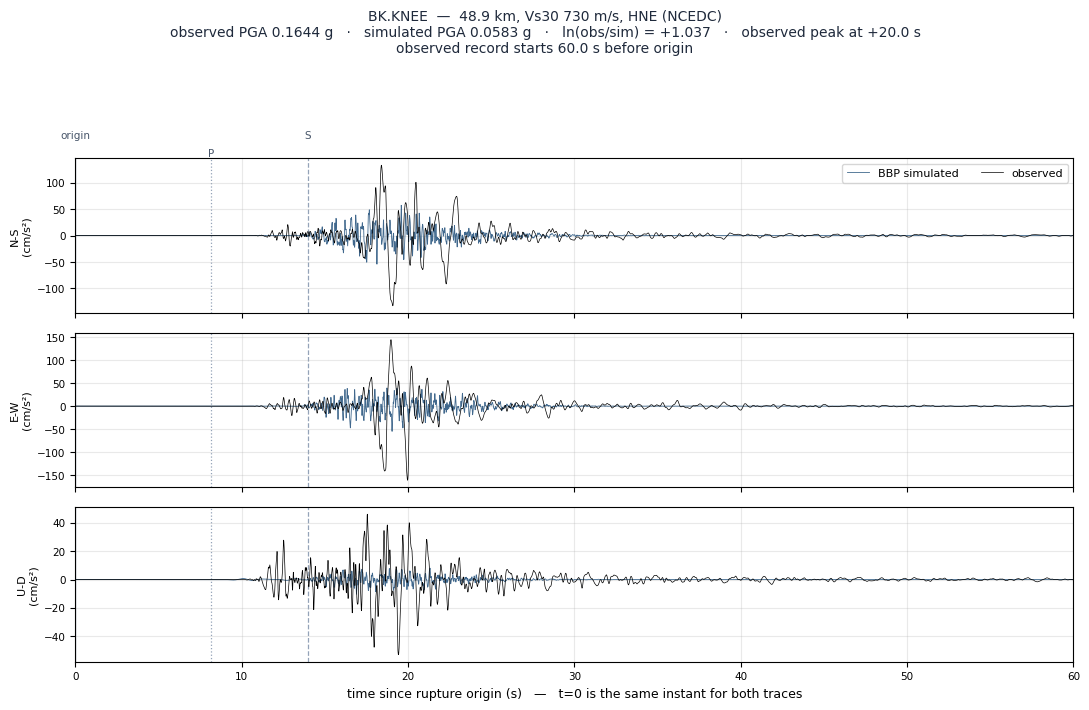
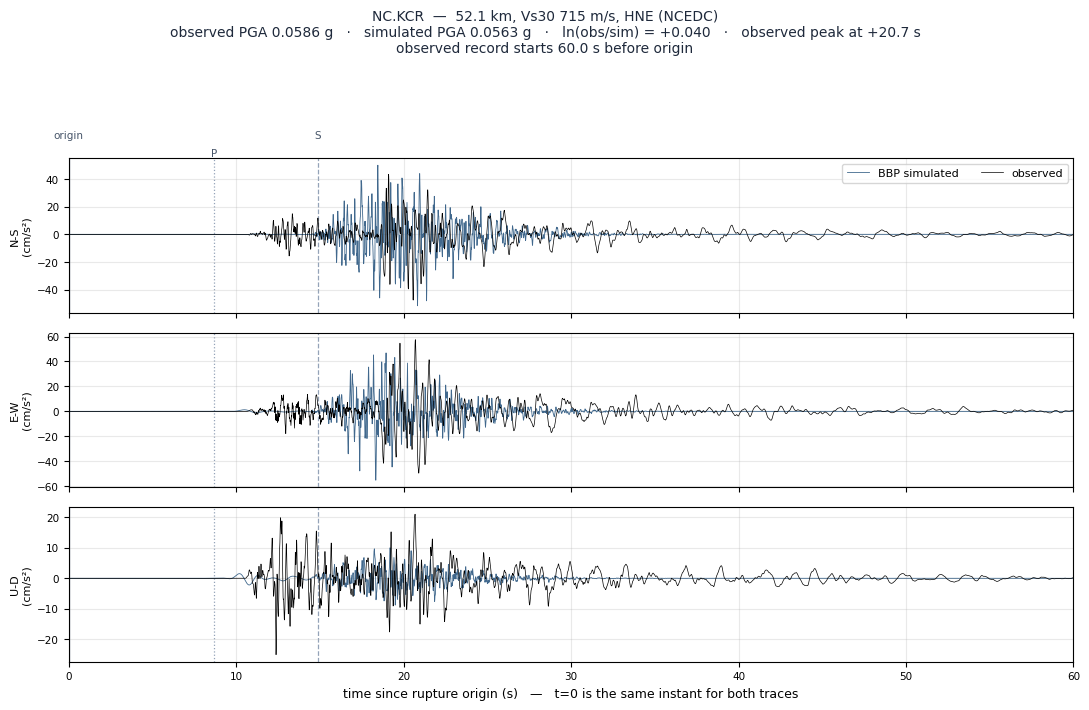
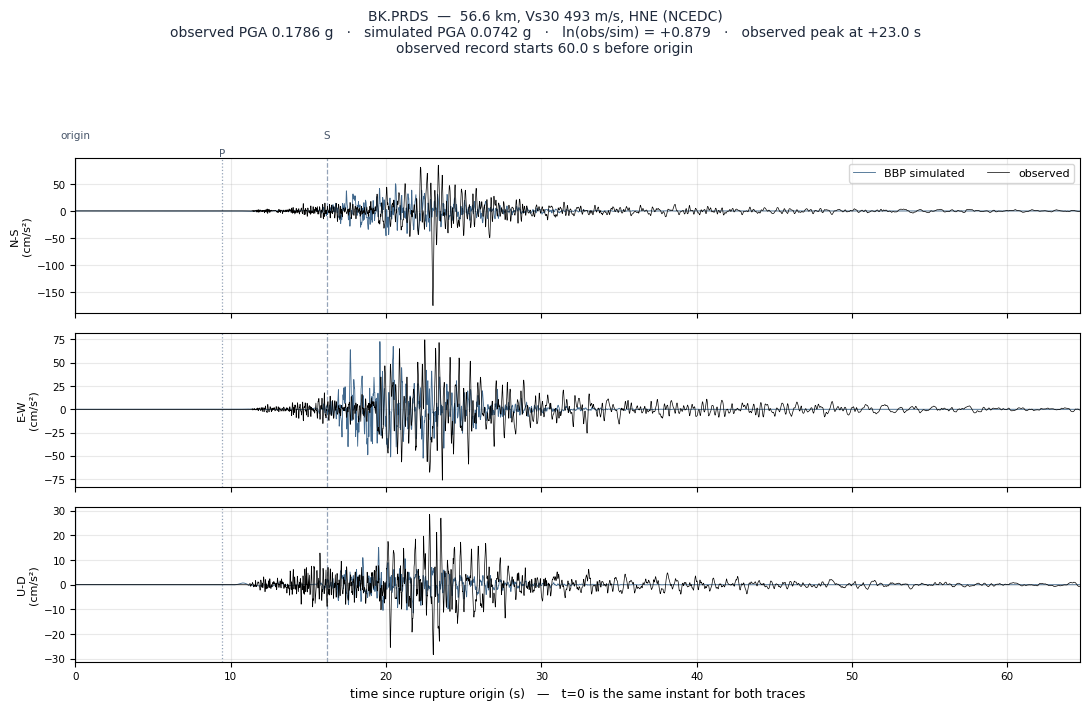
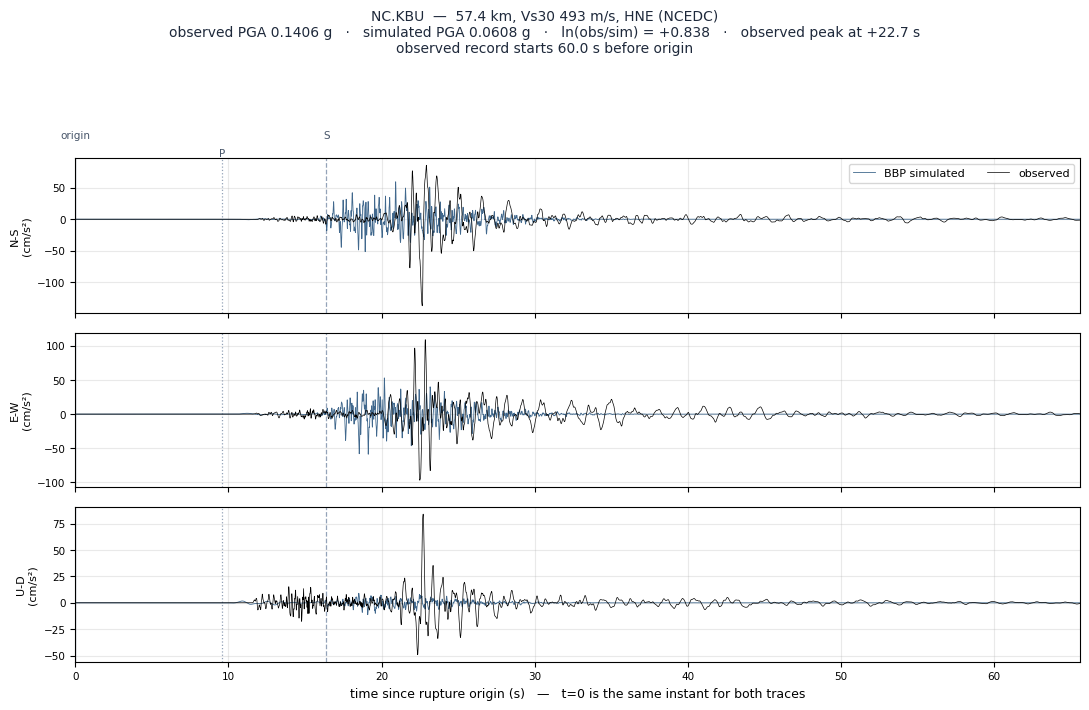
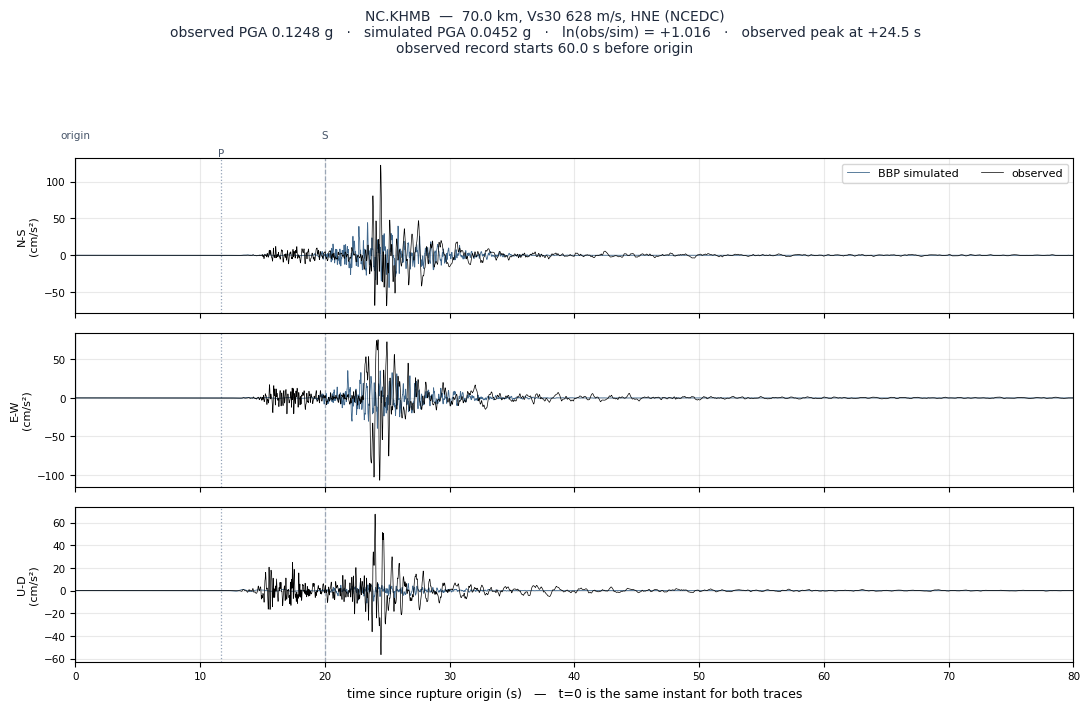
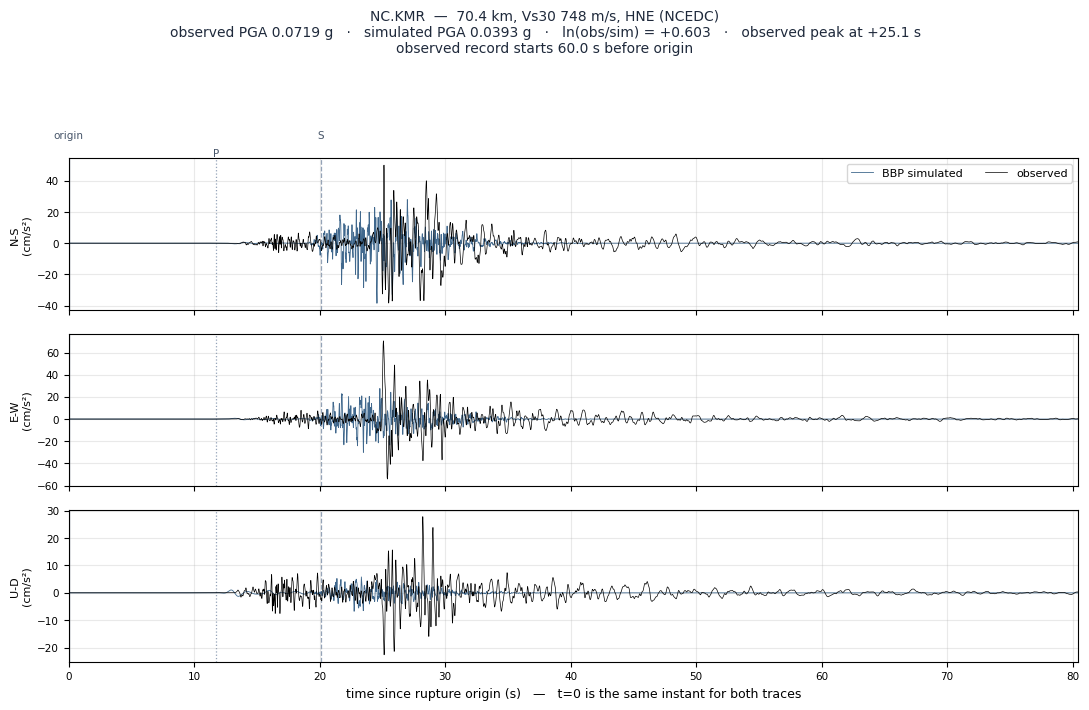
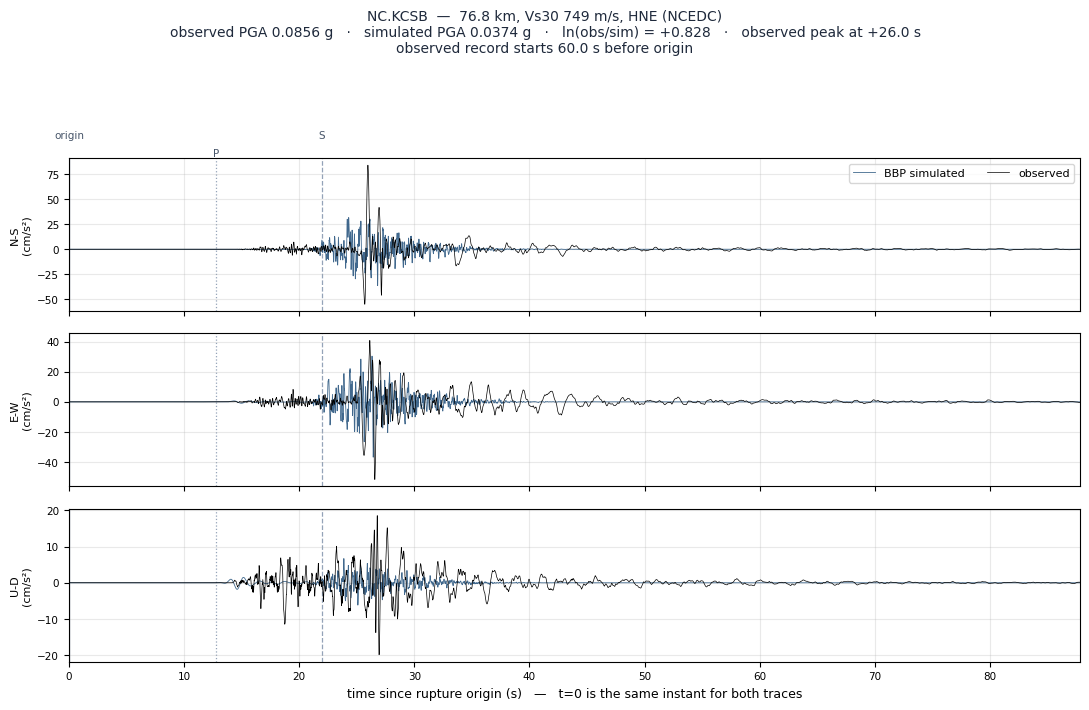
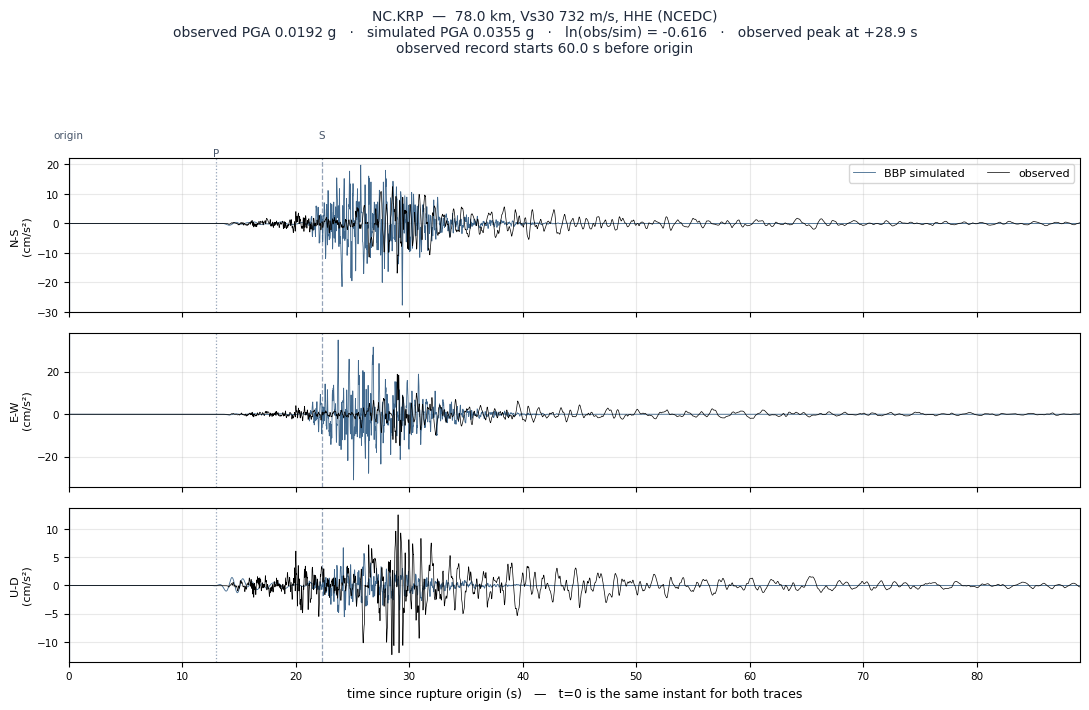
The metric is ln(observed / simulated) RotD50 spectral acceleration, averaged over stations. Positive means the simulation under-predicts — real shaking was larger. Basis: BBP RotD50 residuals (authoritative).
Residual by period
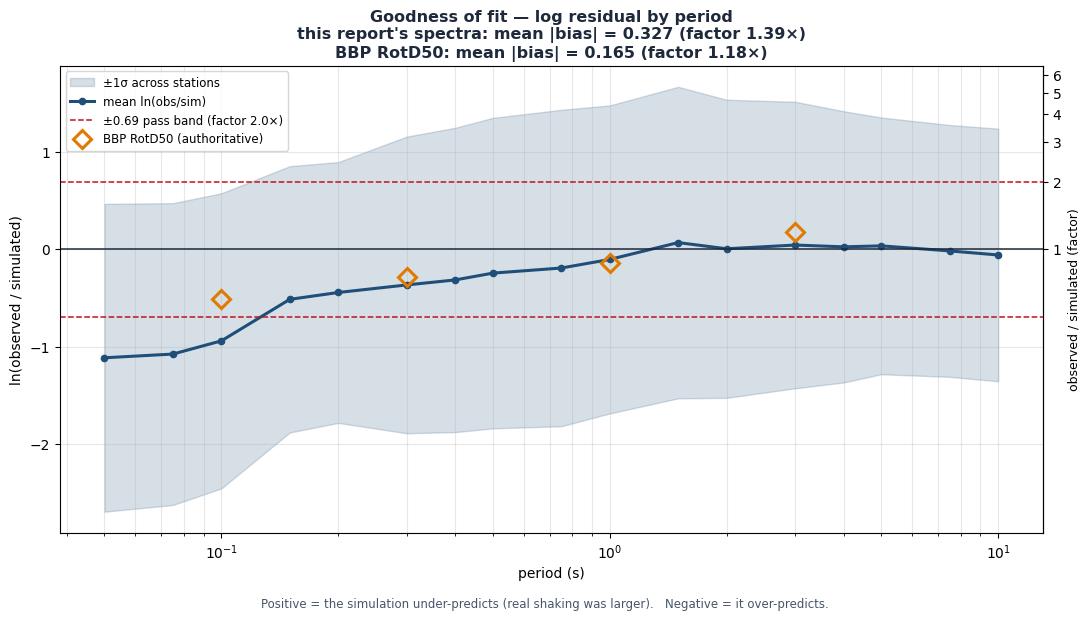
Mean ln(obs/sim) at each spectral period. A structure responds at its own period, so agreement at one period says nothing about another.
| Period | Bias | Simulation | vs. band |
|---|---|---|---|
| 0.1s | -0.512 | over-predicts by 67% | within |
| 0.3s | -0.283 | over-predicts by 33% | within |
| 1s | -0.135 | over-predicts by 14% | within |
| 3s | +0.178 | under-predicts by 19% | within |
Goodness of fit across the spectrum
Mean residual with its ±1σ band, against the pass band. Diamonds are the Broadband Platform’s own RotD50 residuals; the line is this report’s independent recomputation from the waveforms.
Where the stations are
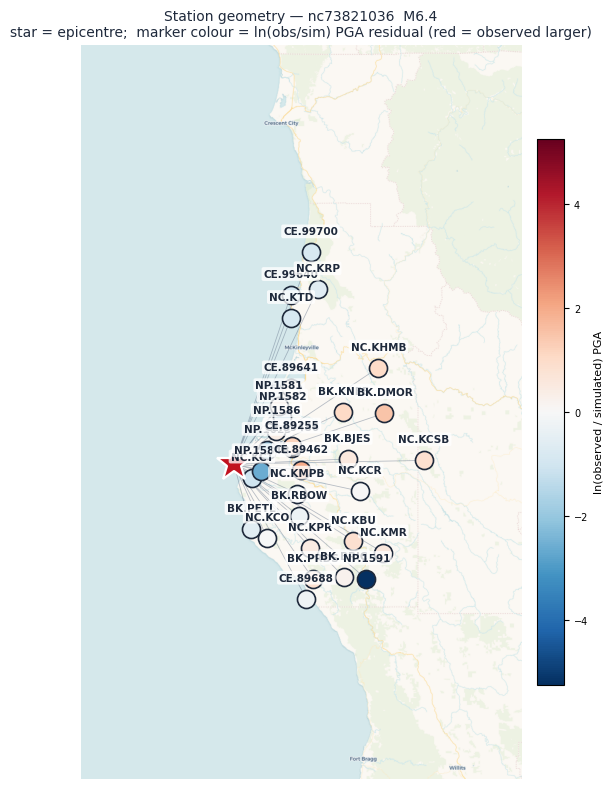
Each station coloured by its PGA residual. Red means the simulation under-predicted the recording; blue means it over-predicted.
Station summary — three independent sources
31 stations with both a recording and a simulated seismogram. Scroll sideways for the full set of columns.
| Station | Dist (km) |
Vs30 BBP |
Vs30 ShakeMap |
Chan | PGA (g) ShakeMap |
PGA (g) obspy |
PGA (g) BBP |
PGV (cm/s) ShakeMap |
PGV (cm/s) obspy |
PGV (cm/s) BBP |
PGD (cm) obspy |
PGD (cm) BBP |
PGD obs/sim |
ln(obs/ sim) |
Flags |
|---|---|---|---|---|---|---|---|---|---|---|---|---|---|---|---|
| NC.KCT | 9.1 | 466 | 466 | HNE | 0.1239 | 0.1189 | 0.3334 | 30.0 | 30.2 | 27.1 | 5.70 | 8.08 | 0.71x | -1.031 | — |
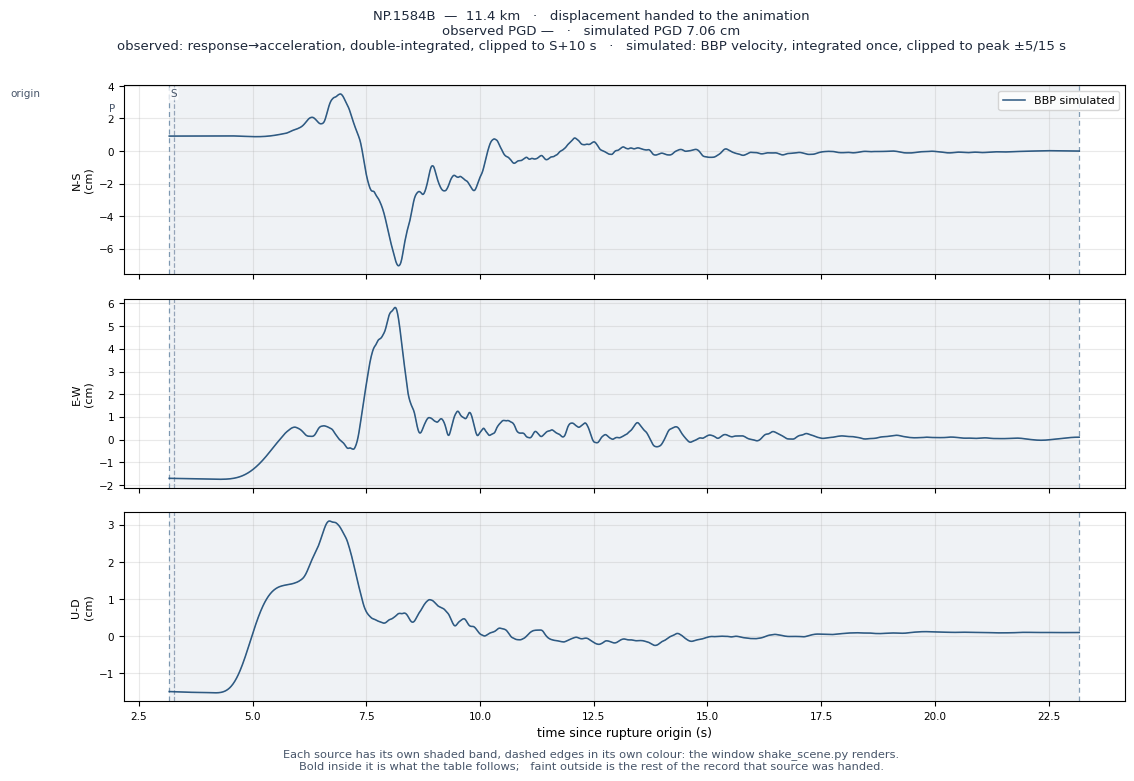
| NP.1584B | 11.4 | 458 | 458 | HNE | 0.2212 | 0.0190 | 0.2577 | 10.3 | 0.7 | 17.5 | — | 7.06 | — | -2.608 | — |
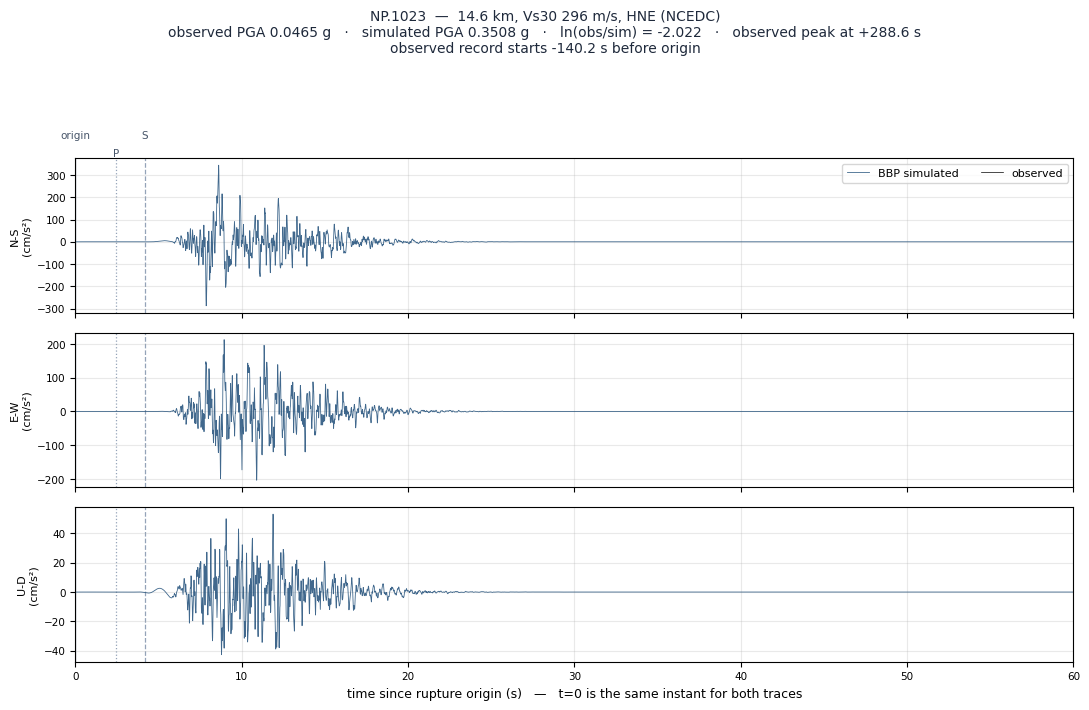
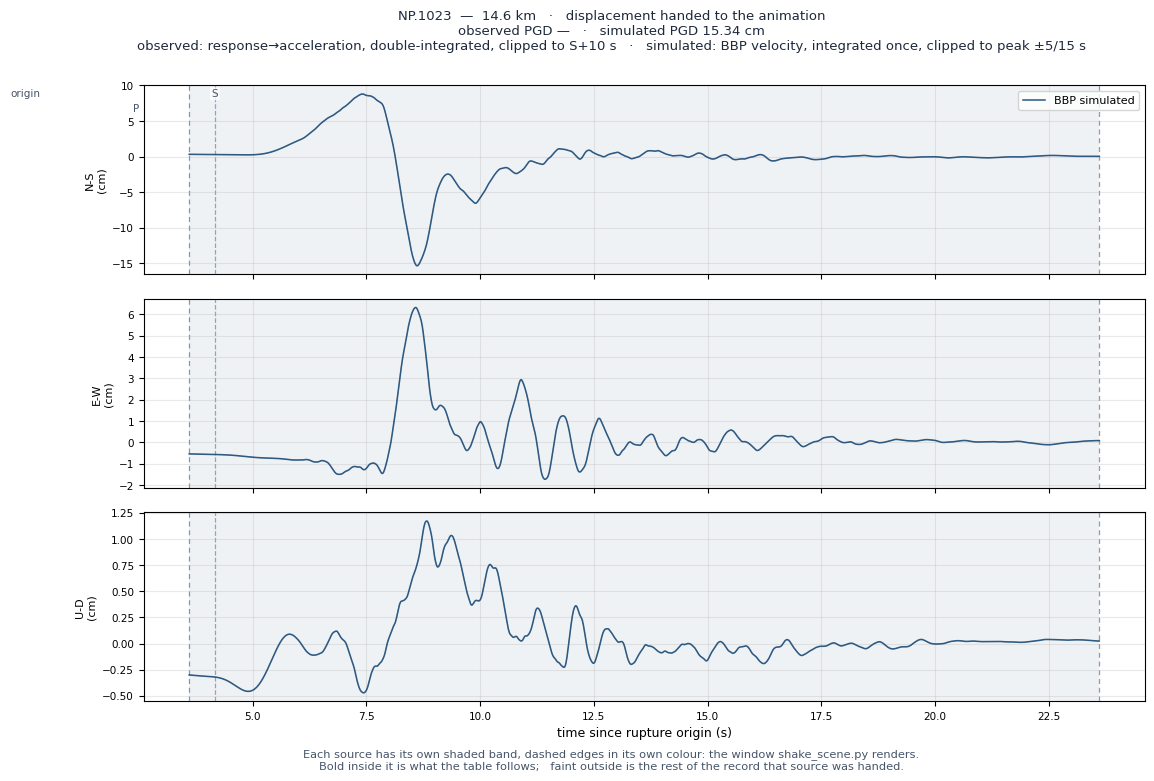
| NP.1023 | 14.6 | 296 | 296 | HNE | 0.2561 | 0.0465 | 0.3508 | 22.3 | 1.5 | 43.0 | — | 15.34 | — | -2.022 | — |
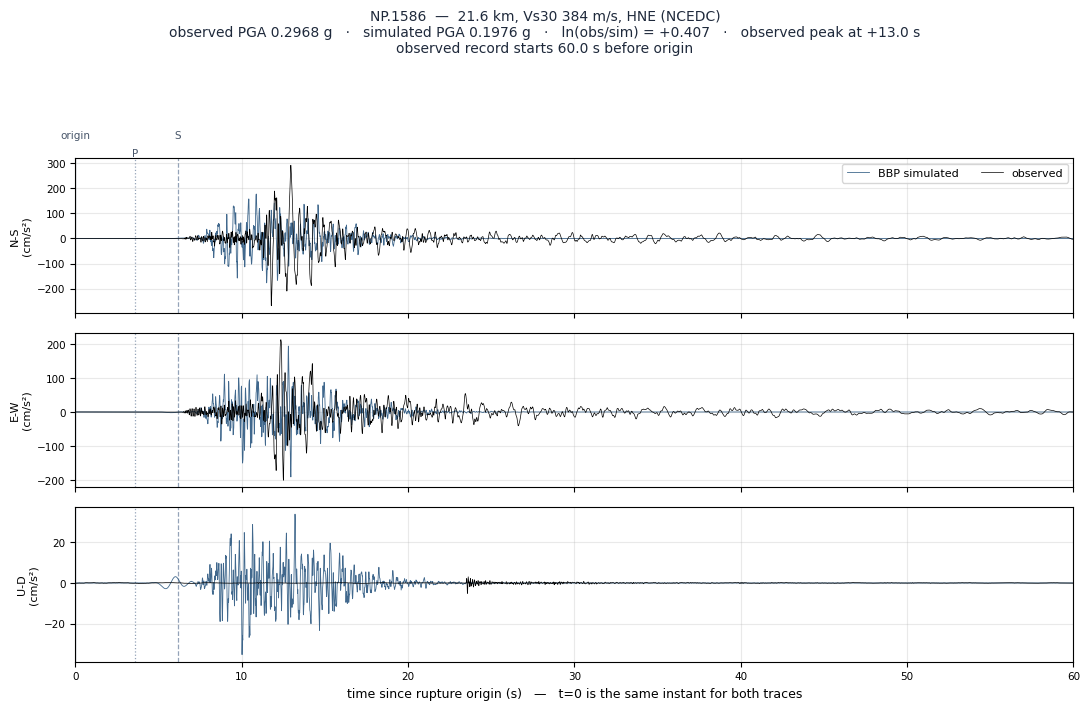
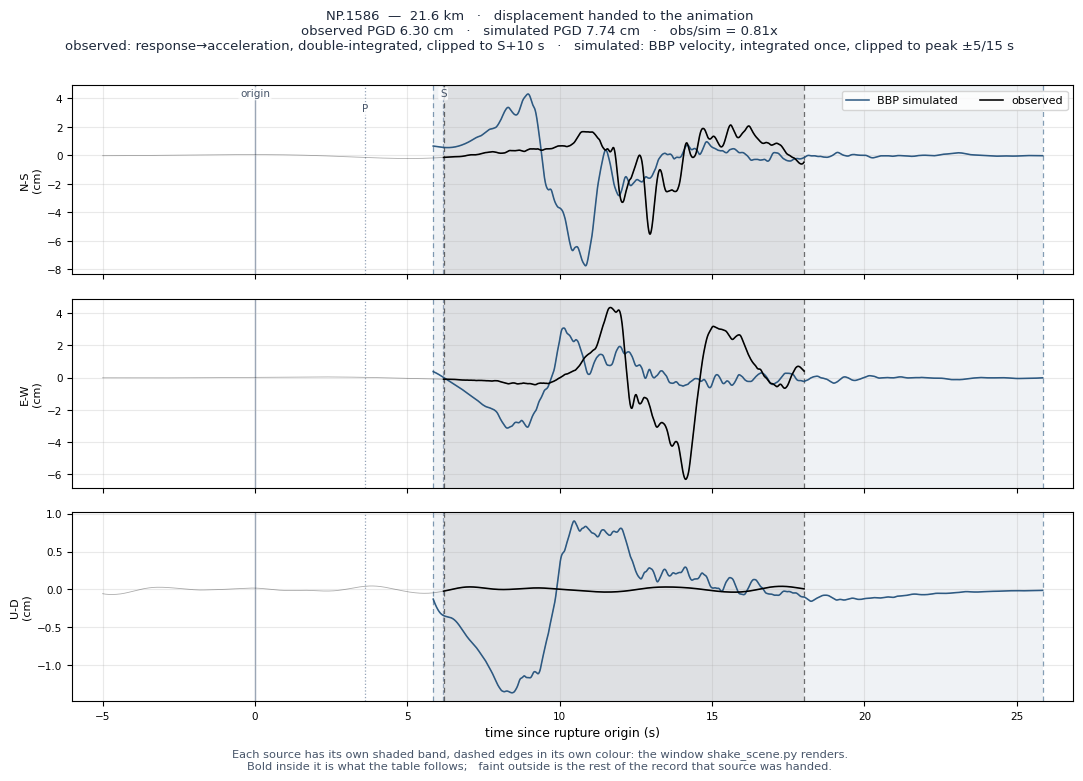
| NP.1586 | 21.6 | 384 | 384 | HNE | 0.3000 | 0.2968 | 0.1976 | 25.8 | 27.3 | 19.6 | 6.30 | 7.74 | 0.81x | +0.407 | — |
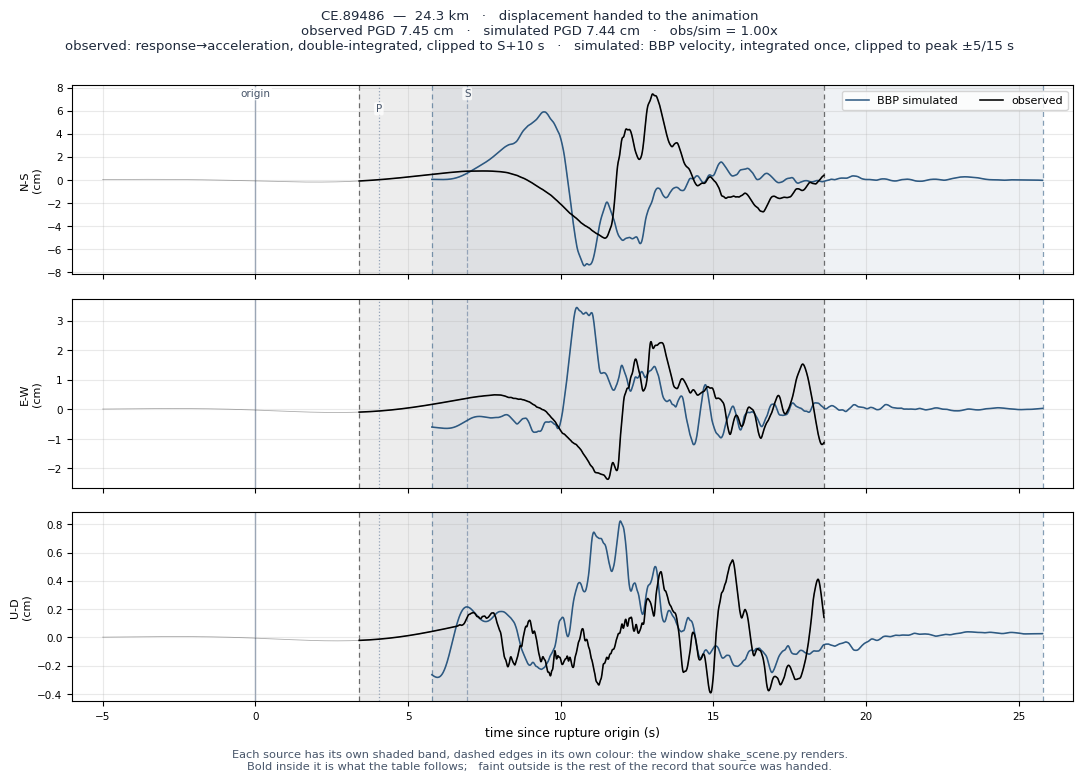
| CE.89486 | 24.3 | 339 | 339 | HNE | 0.3938 | 0.3974 | 0.1934 | 28.7 | 34.9 | 22.3 | 7.45 | 7.44 | 1.00x | +0.720 | — |
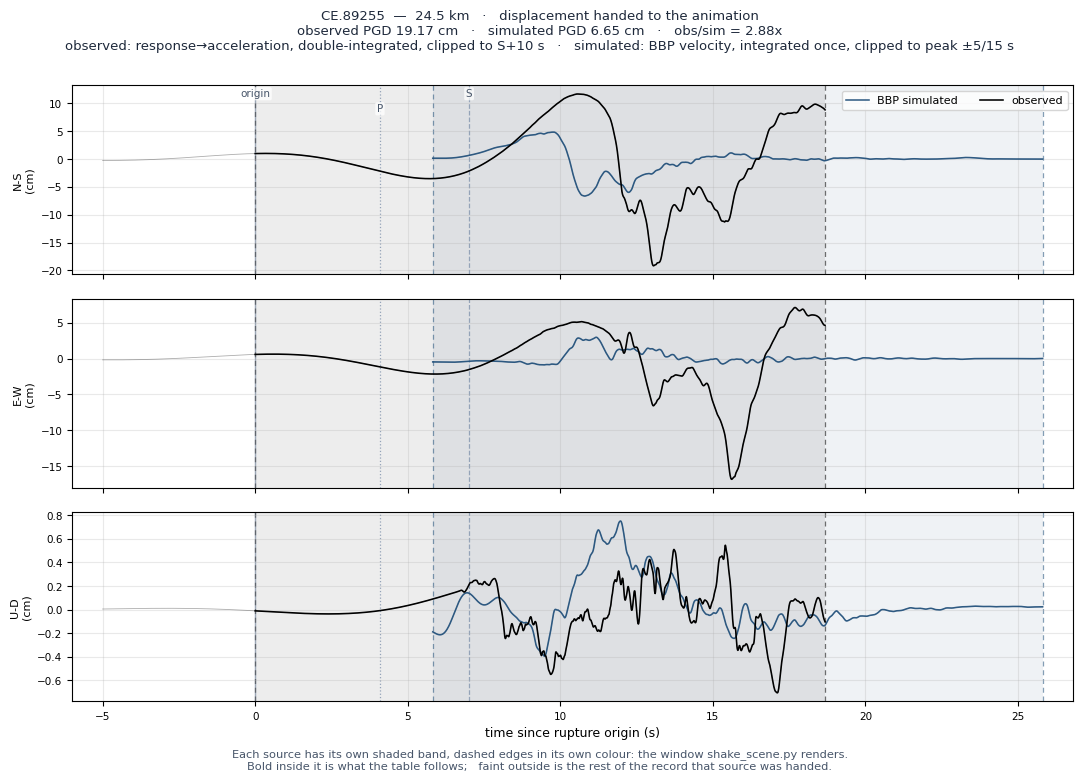
| CE.89255 | 24.5 | 382 | 382 | HNE | 0.8010 | 0.6483 | 0.1918 | 34.8 | 59.7 | 23.4 | 19.17 | 6.65 | 2.88x | +1.218 | — |
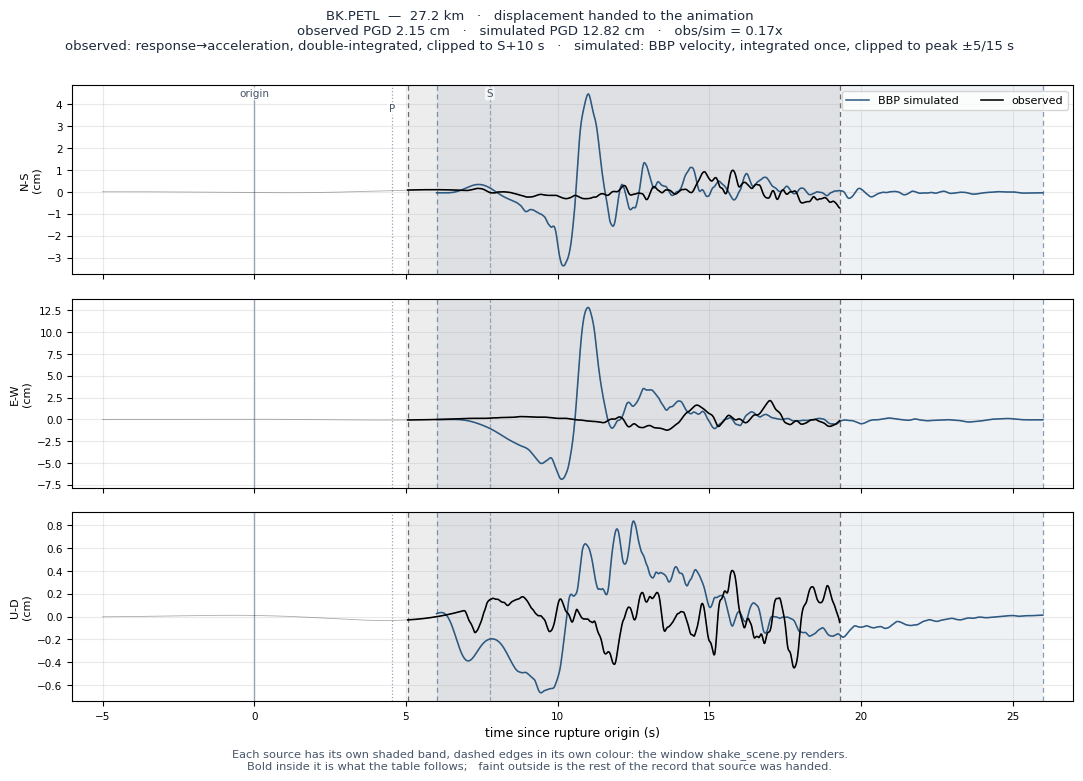
| BK.PETL | 27.2 | 347 | 347 | HNE | 0.1236 | 0.1232 | 0.2198 | 8.5 | 8.5 | 48.5 | 2.15 | 12.82 | 0.17x | -0.579 | — |
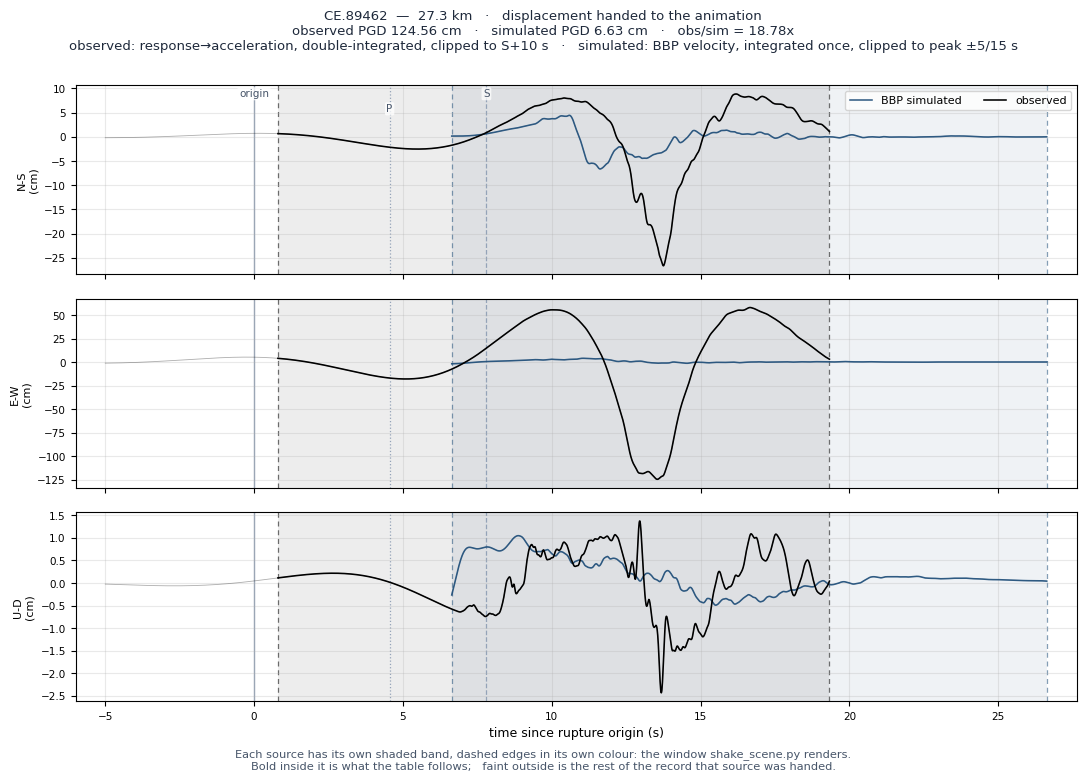
| CE.89462 | 27.3 | 302 | 302 | HNE | 1.4387 | 1.3867 | 0.1864 | 63.4 | 178.6 | 21.5 | 124.56 | 6.63 | 18.78x | +2.007 | — |
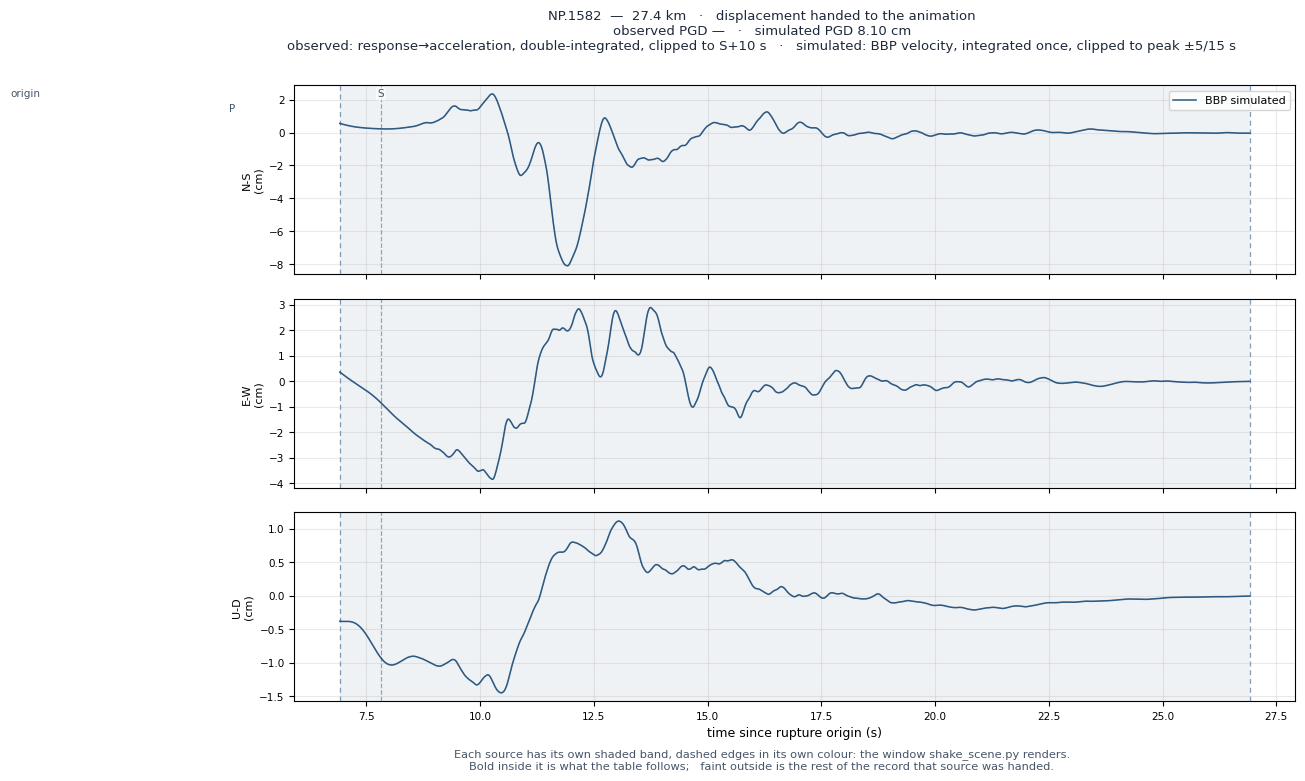
| NP.1582 | 27.4 | 334 | 334 | HNE | 0.4536 | 0.0719 | 0.1724 | 34.1 | 2.3 | 24.2 | — | 8.10 | — | -0.875 | — |
| NC.KMPB | 28.2 | 490 | 490 | HNE | 0.1237 | 0.1226 | 0.1539 | 11.7 | 12.5 | 10.5 | 3.56 | 3.81 | 0.93x | -0.228 | — |
| NP.1581 | 29.6 | 326 | 326 | HNE | 0.2748 | 0.2718 | 0.2098 | 32.5 | 31.5 | 21.4 | 7.87 | 8.08 | 0.97x | +0.259 | — |
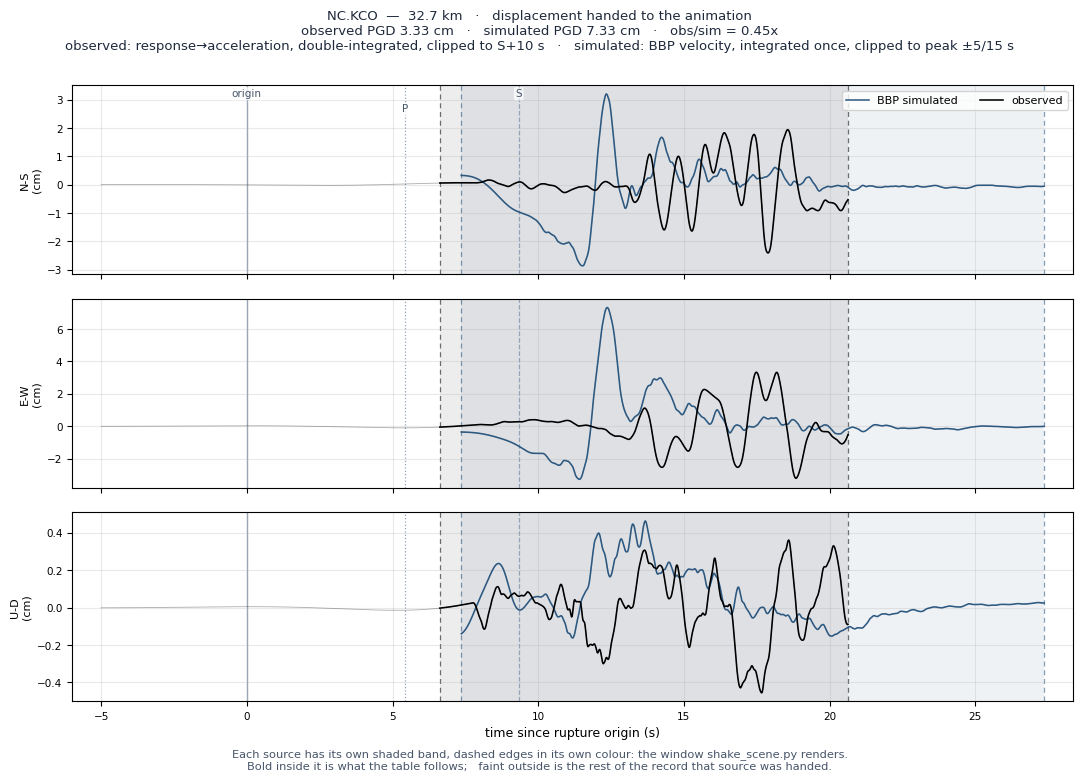
| NC.KCO | 32.7 | 487 | 487 | HNE | 0.1201 | 0.1201 | 0.1240 | 15.3 | 15.6 | 19.6 | 3.33 | 7.33 | 0.45x | -0.033 | — |
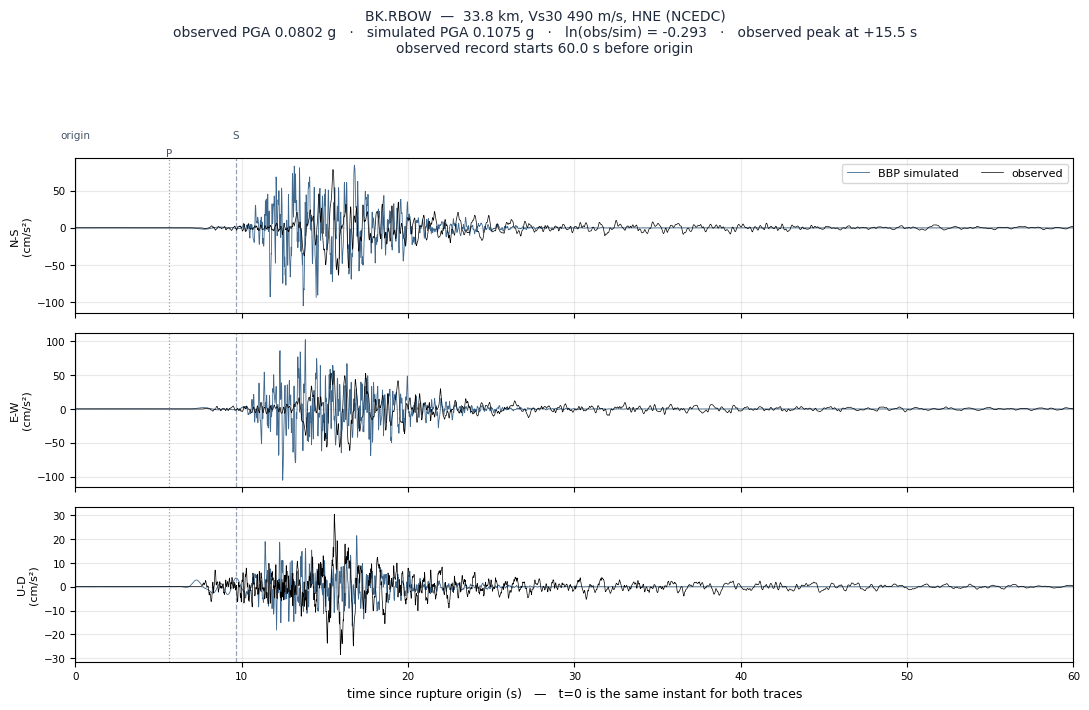
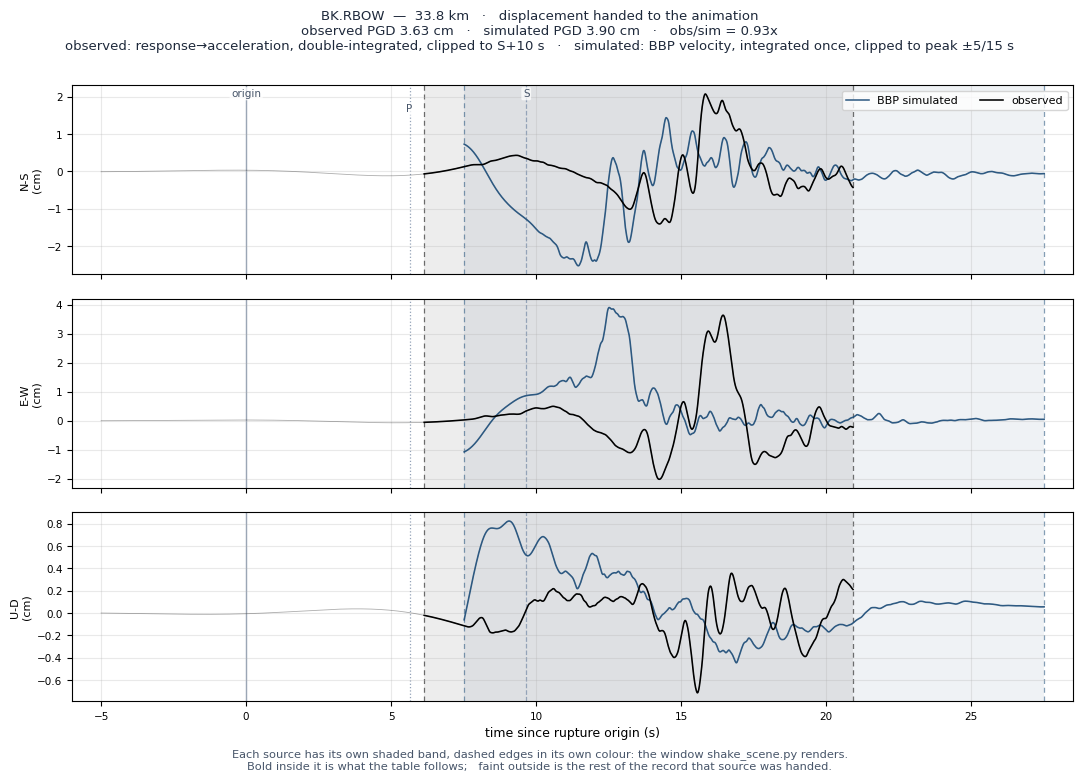
| BK.RBOW | 33.8 | 490 | 490 | HNE | 0.0795 | 0.0802 | 0.1075 | 10.5 | 11.0 | 10.5 | 3.63 | 3.90 | 0.93x | -0.293 | — |
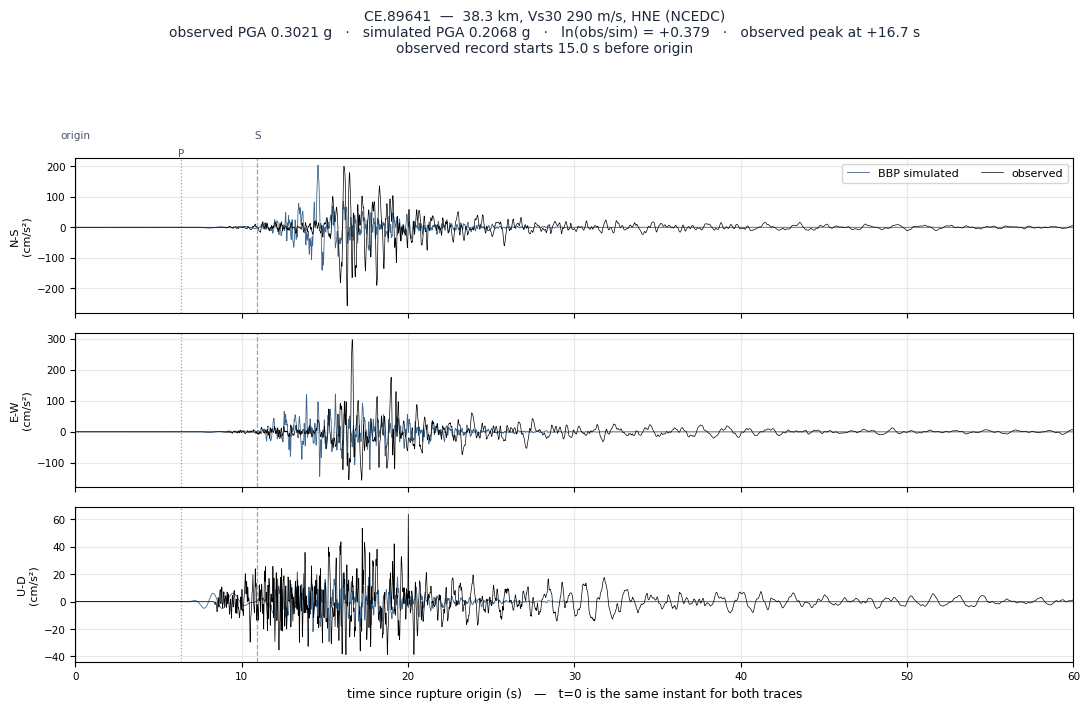
| CE.89641 | 38.3 | 290 | 290 | HNE | 0.2959 | 0.3021 | 0.2068 | 21.4 | 24.8 | 17.9 | 6.16 | 6.19 | 1.00x | +0.379 | — |
| BK.BJES | 45.9 | 744 | 744 | HNE | 0.1254 | 0.1238 | 0.0723 | 22.0 | 20.8 | 6.0 | 6.89 | 2.53 | 2.72x | +0.538 | — |
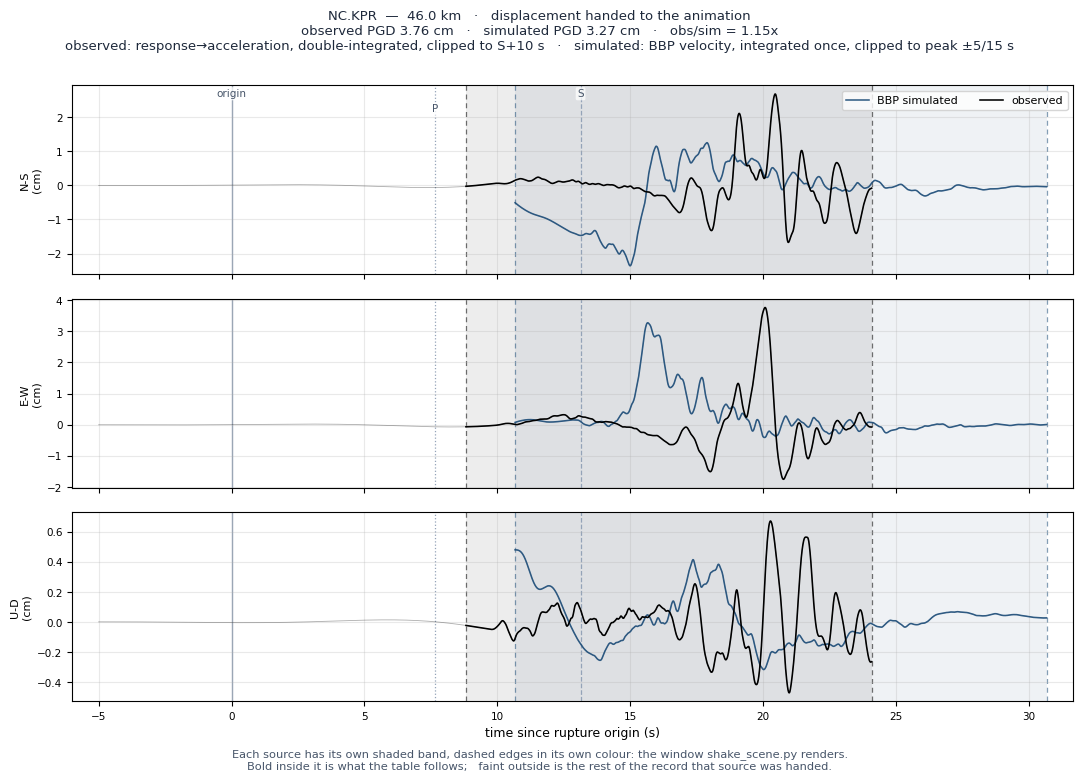
| NC.KPR | 46.0 | 492 | 492 | HNE | 0.1402 | 0.1397 | 0.0900 | 15.6 | 15.6 | 6.9 | 3.76 | 3.27 | 1.15x | +0.440 | — |
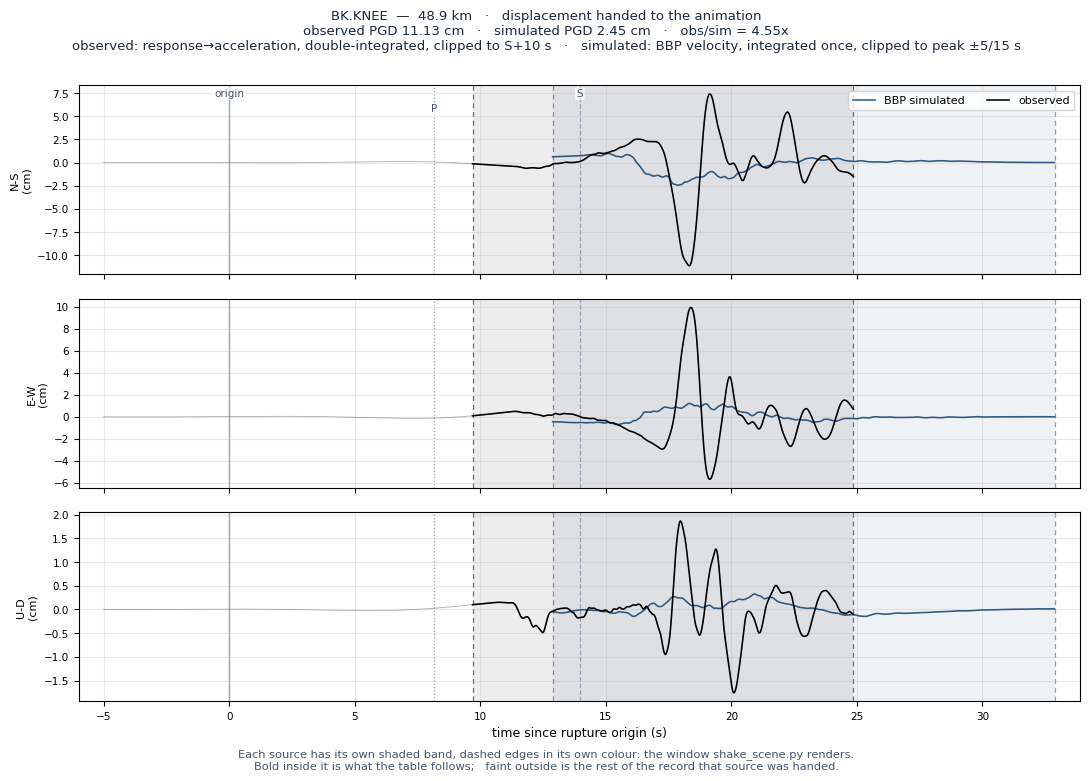
| BK.KNEE | 48.9 | 730 | 730 | HNE | 0.1636 | 0.1644 | 0.0583 | 39.2 | 38.2 | 5.3 | 11.13 | 2.45 | 4.55x | +1.037 | — |
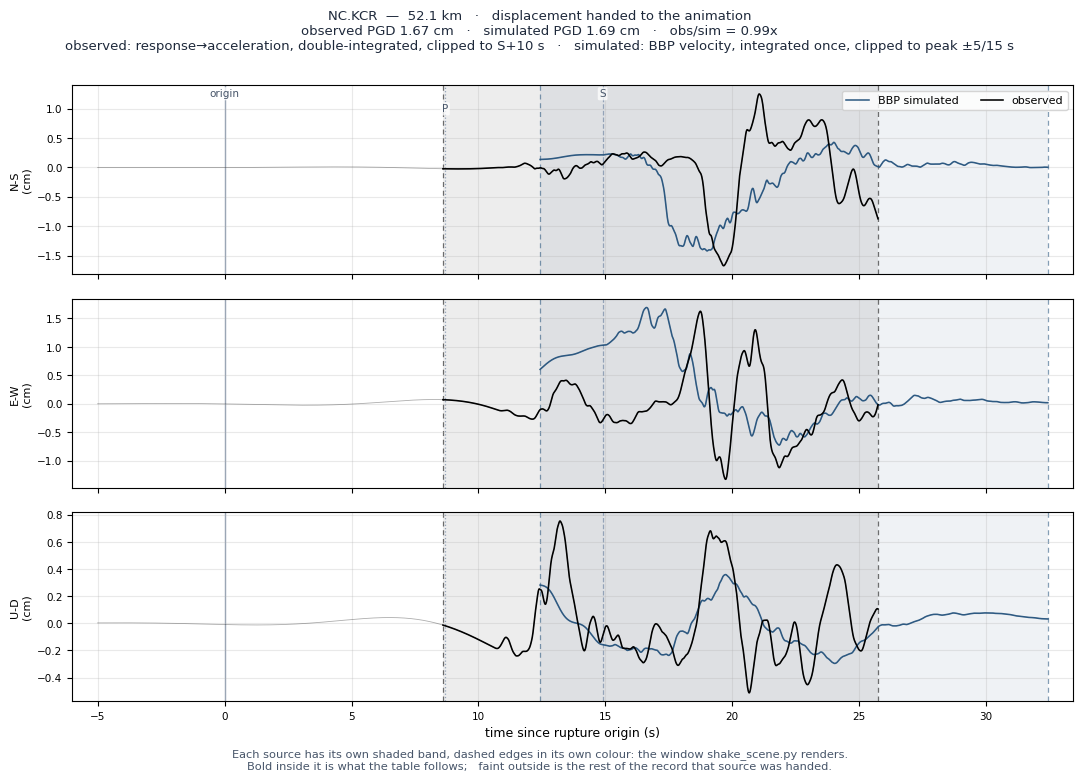
| NC.KCR | 52.1 | 715 | 715 | HNE | 0.0585 | 0.0586 | 0.0563 | 6.8 | 6.7 | 4.0 | 1.67 | 1.69 | 0.99x | +0.040 | — |
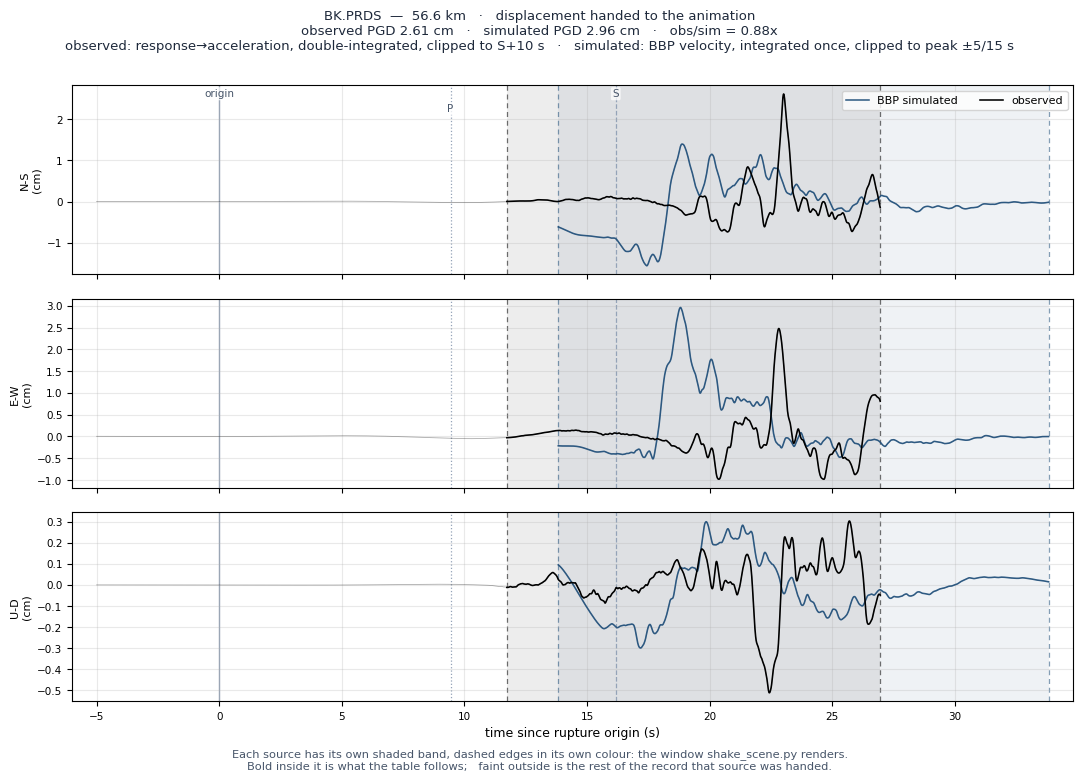
| BK.PRDS | 56.6 | 493* | 493 | HNE | 0.1806 | 0.1786 | 0.0742 | 9.7 | 10.6 | 6.0 | 2.61 | 2.96 | 0.88x | +0.879 | Vs30d |
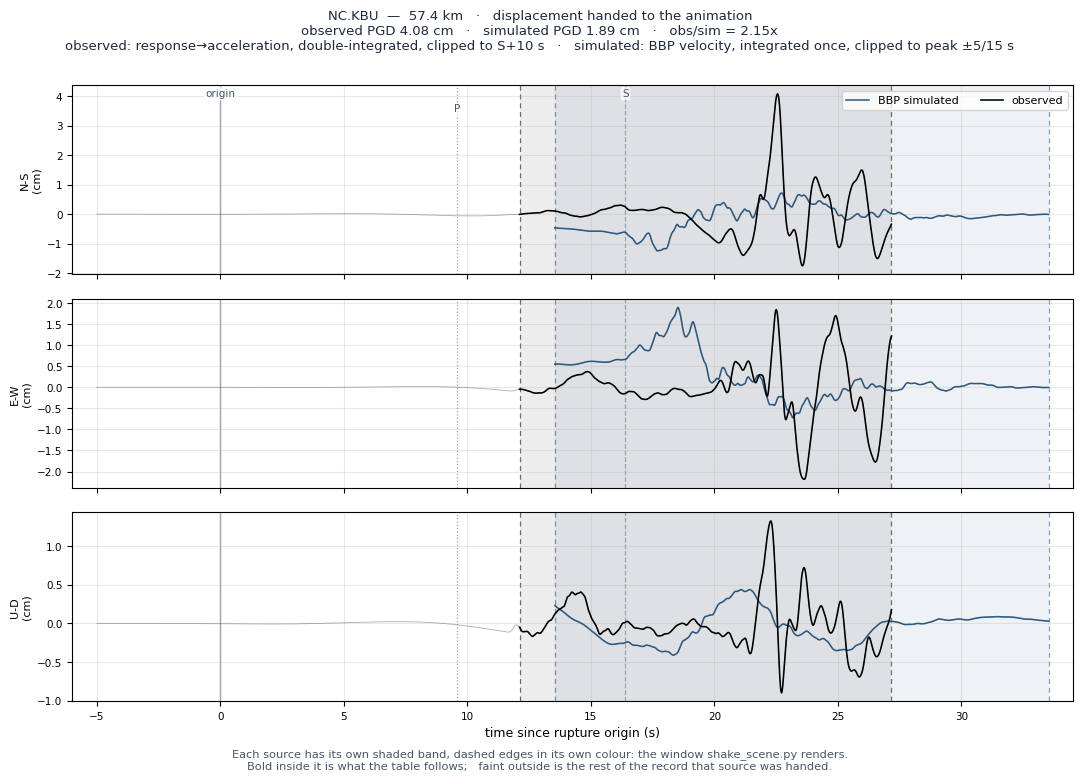
| NC.KBU | 57.4 | 493* | 493 | HNE | 0.1382 | 0.1406 | 0.0608 | 18.5 | 17.6 | 3.6 | 4.08 | 1.89 | 2.15x | +0.838 | Vs30d |
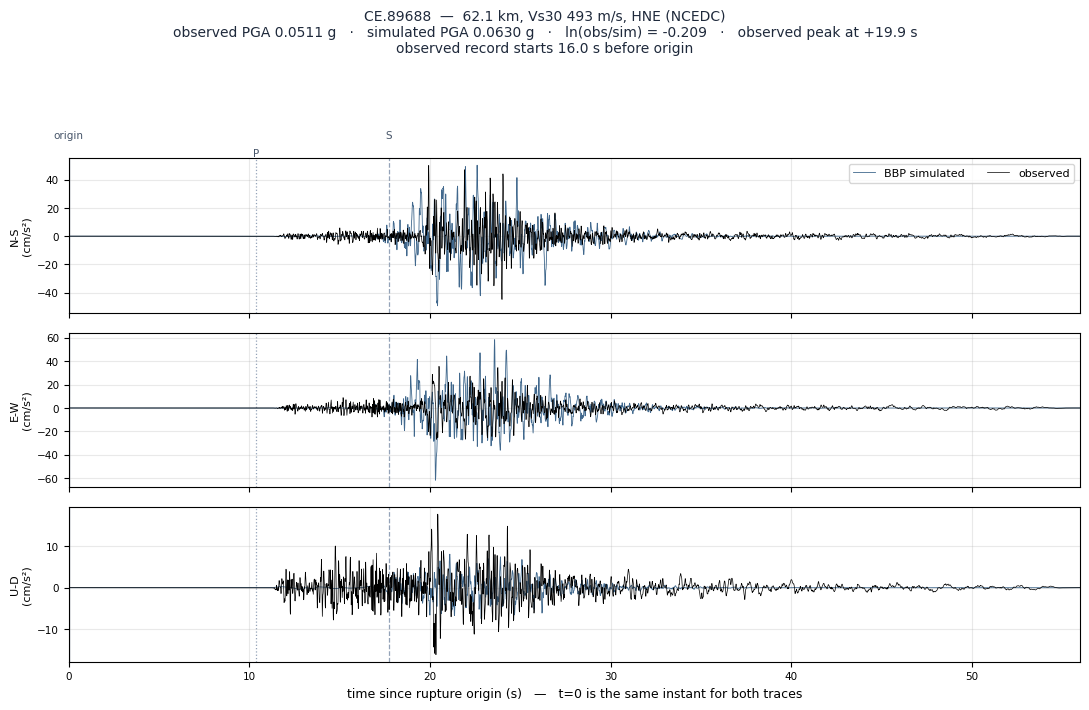
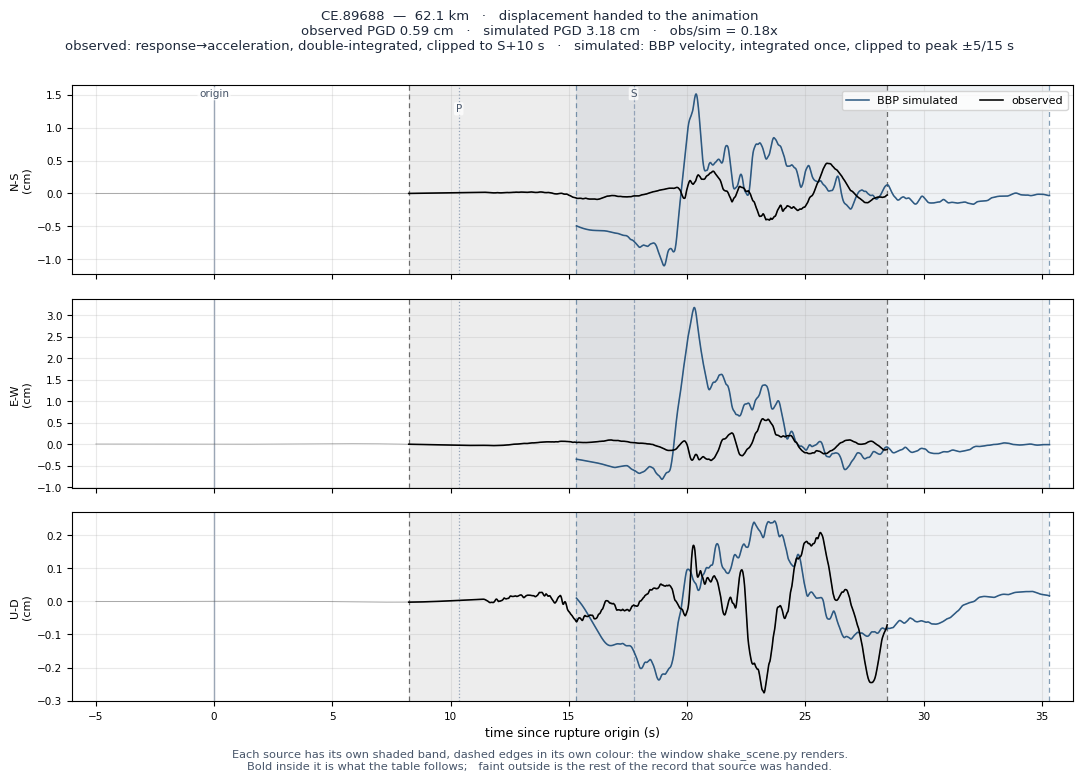
| CE.89688 | 62.1 | 493* | 493 | HNE | 0.0506 | 0.0511 | 0.0630 | 2.4 | 2.5 | 5.5 | 0.59 | 3.18 | 0.18x | -0.209 | Vs30d |
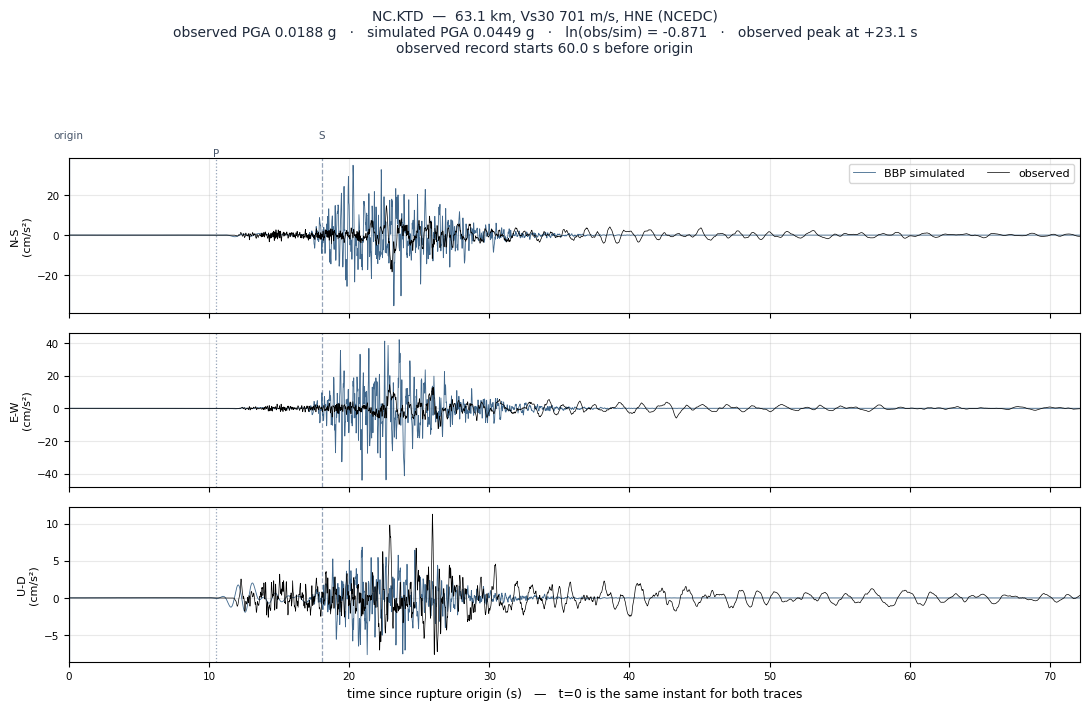
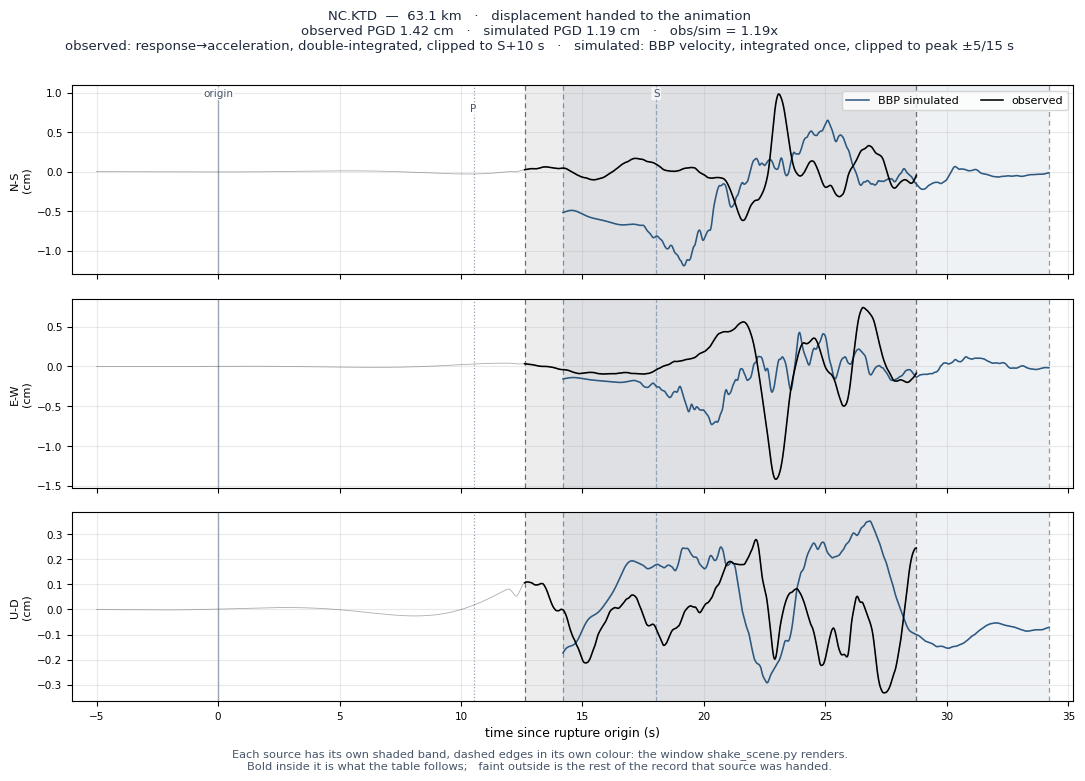
| NC.KTD | 63.1 | 701 | 701 | HNE | 0.0195 | 0.0188 | 0.0449 | 3.1 | 3.3 | 3.0 | 1.42 | 1.19 | 1.19x | -0.871 | — |
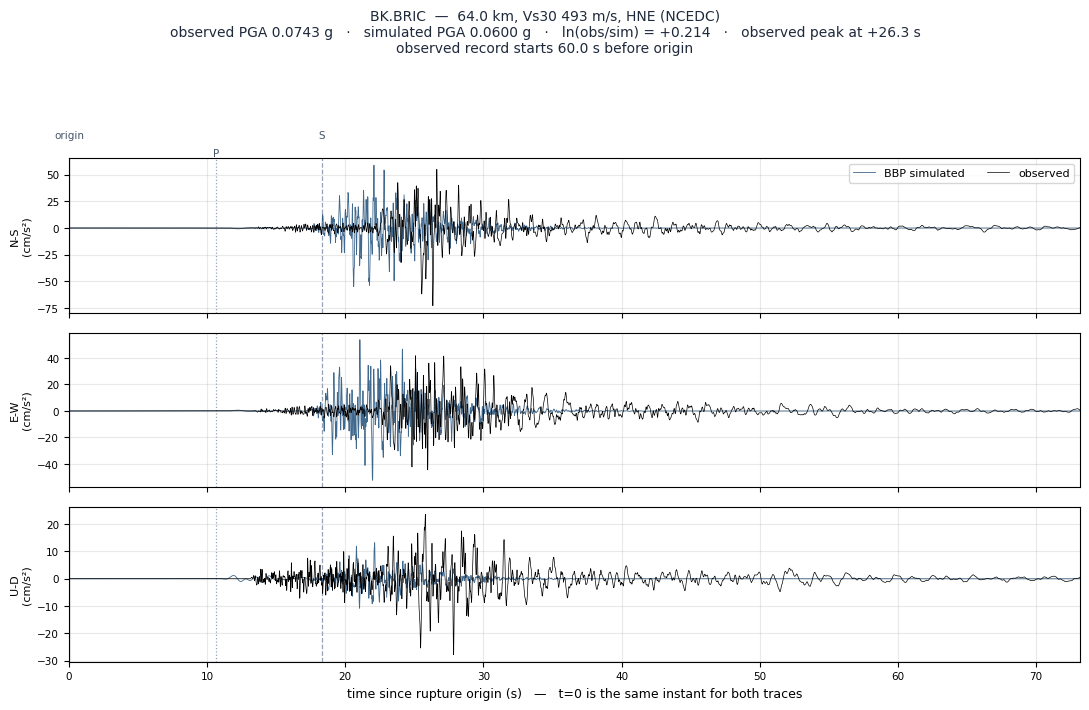
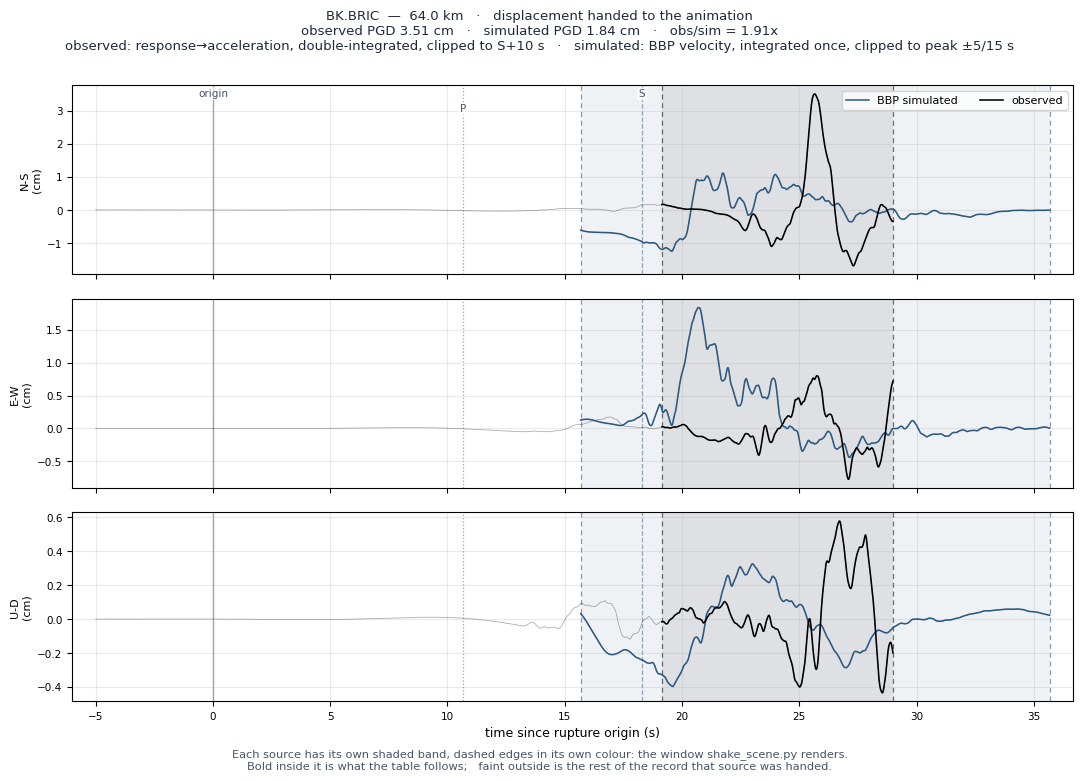
| BK.BRIC | 64.0 | 493* | 493 | HNE | 0.0752 | 0.0743 | 0.0600 | 7.8 | 8.8 | 4.6 | 3.51 | 1.84 | 1.91x | +0.214 | Vs30d |
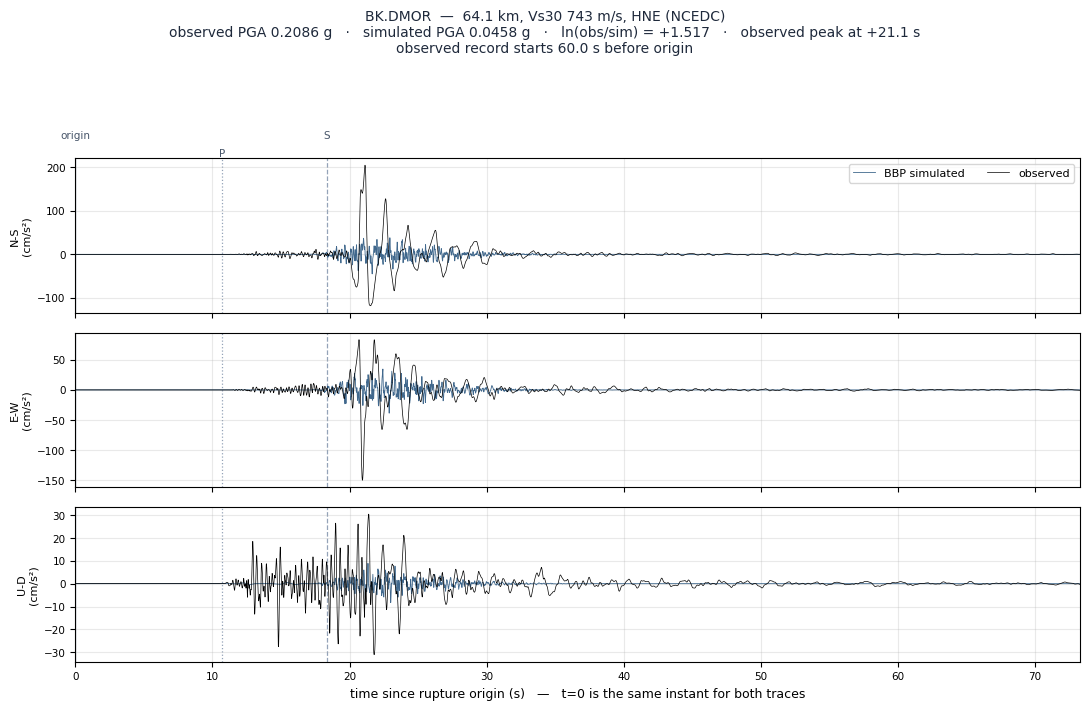
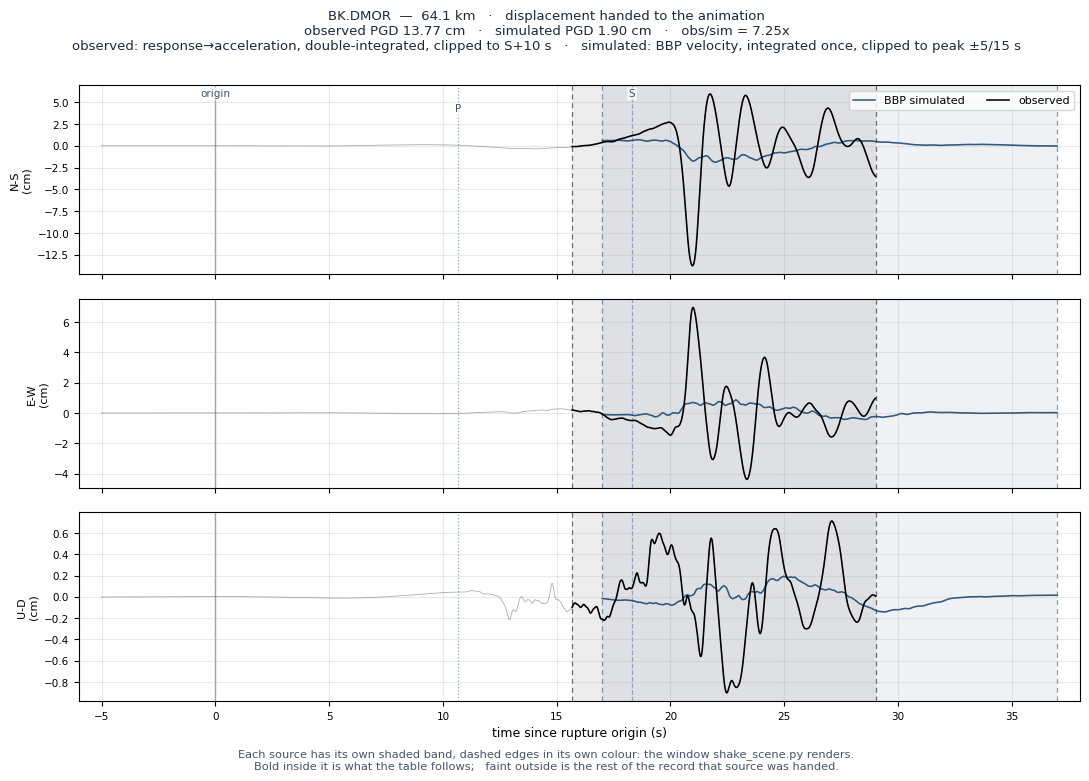
| BK.DMOR | 64.1 | 743 | 743 | HNE | 0.2033 | 0.2086 | 0.0458 | 47.8 | 45.6 | 4.2 | 13.77 | 1.90 | 7.25x | +1.517 | Manu,Outl |
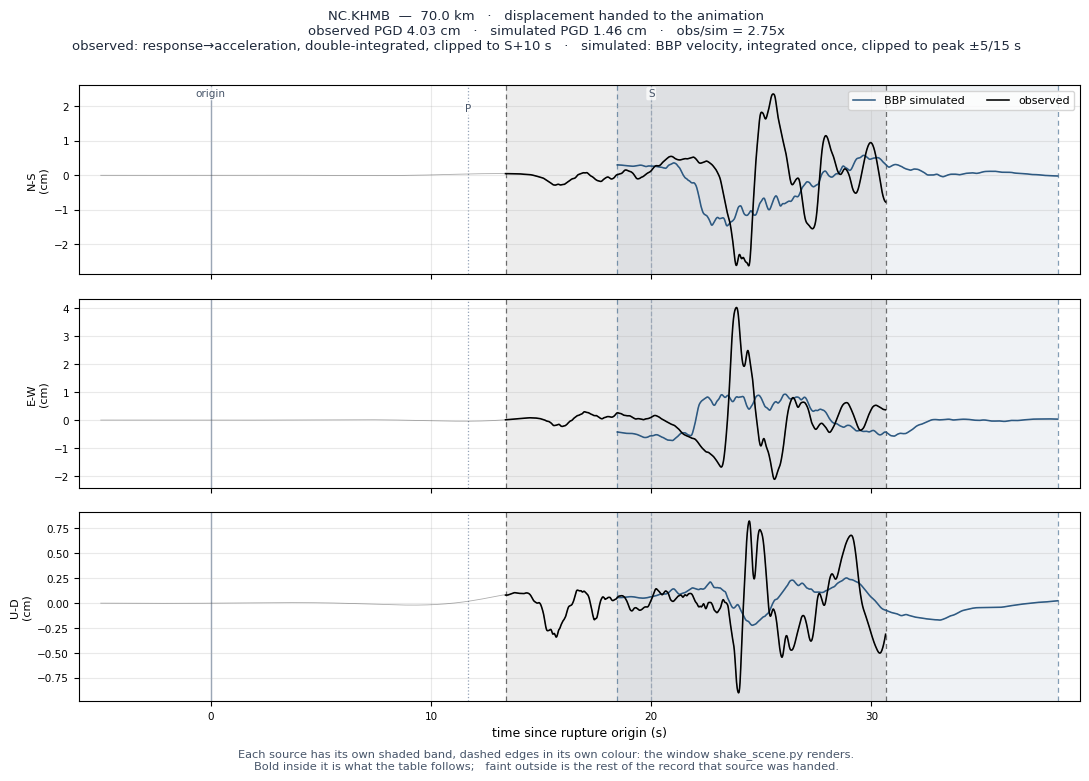
| NC.KHMB | 70.0 | 628 | 628 | HNE | 0.1253 | 0.1248 | 0.0452 | 15.1 | 16.0 | 4.1 | 4.03 | 1.46 | 2.75x | +1.016 | — |
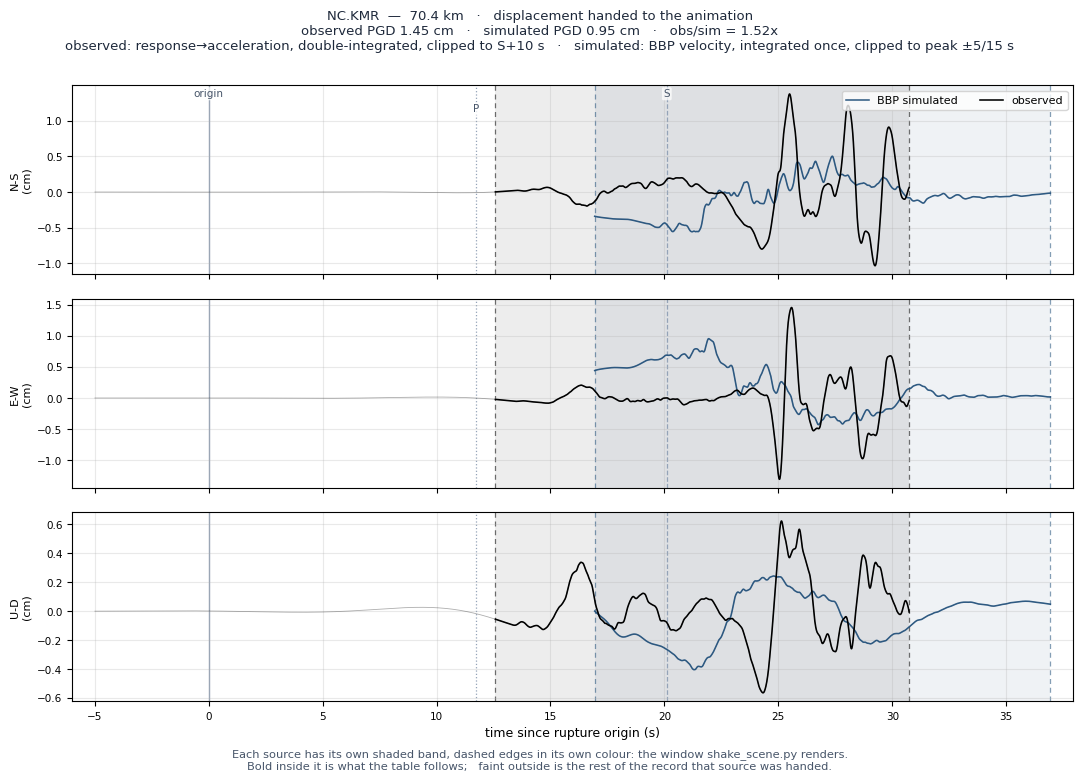
| NC.KMR | 70.4 | 748 | 748 | HNE | 0.0721 | 0.0719 | 0.0393 | 9.5 | 9.6 | 2.7 | 1.45 | 0.95 | 1.52x | +0.603 | — |
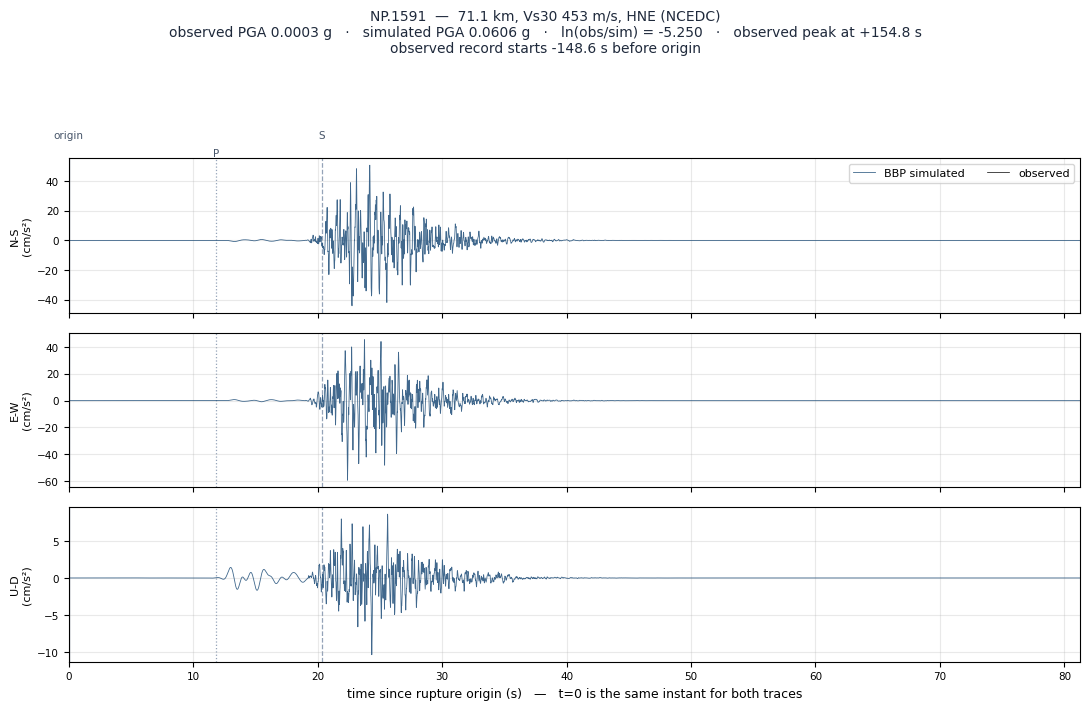
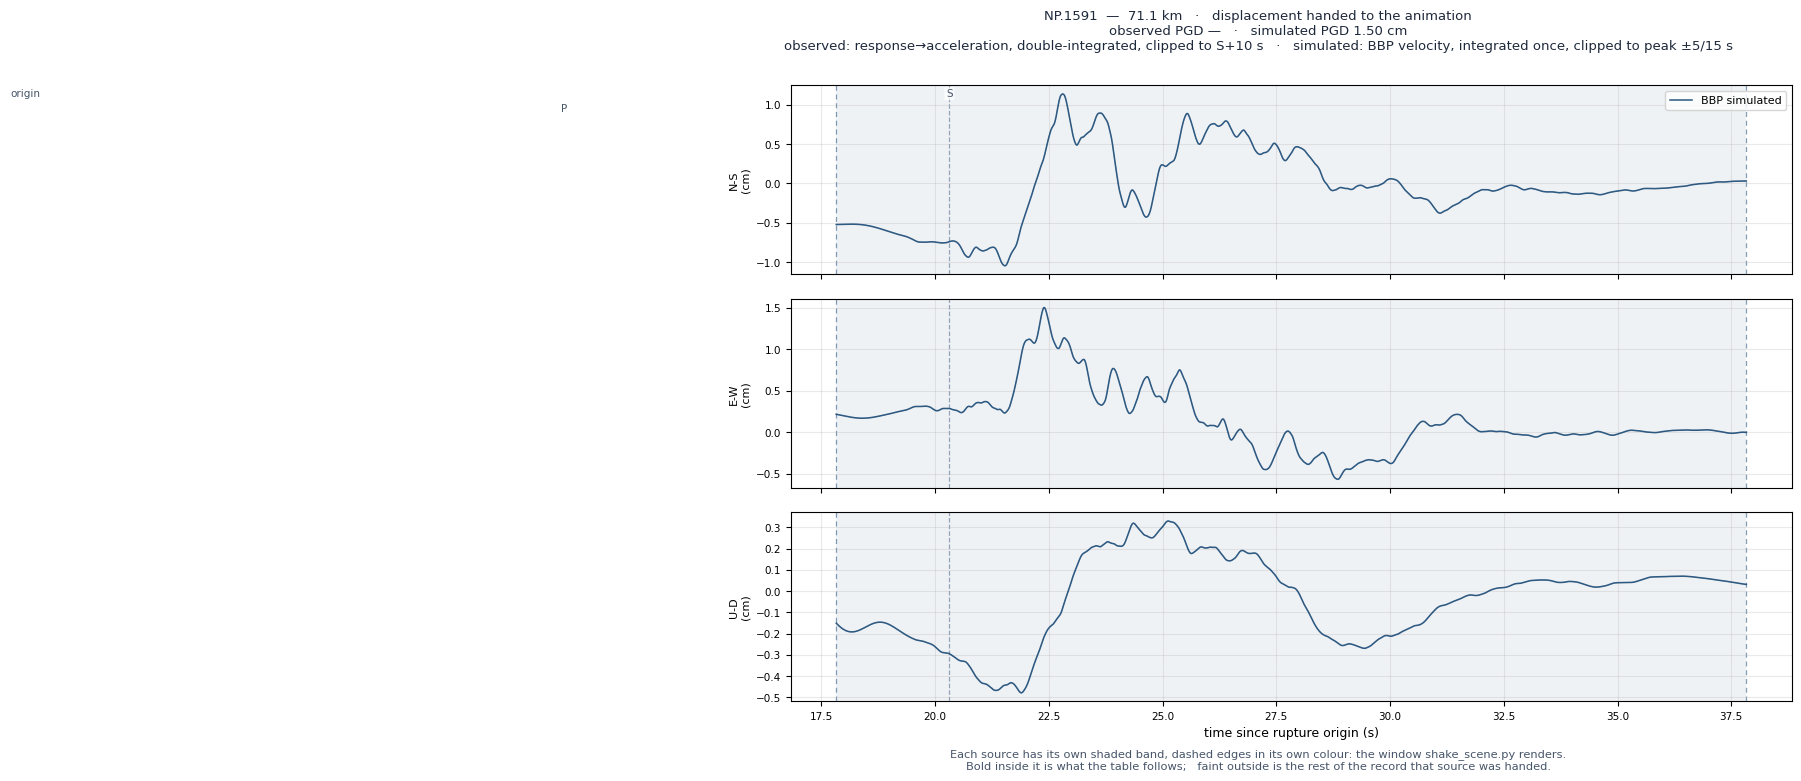
| NP.1591 | 71.1 | 453 | 453 | HNE | 0.0950 | 0.0003 | 0.0606 | 9.0 | 0.1 | 4.3 | — | 1.50 | — | -5.250 | — |
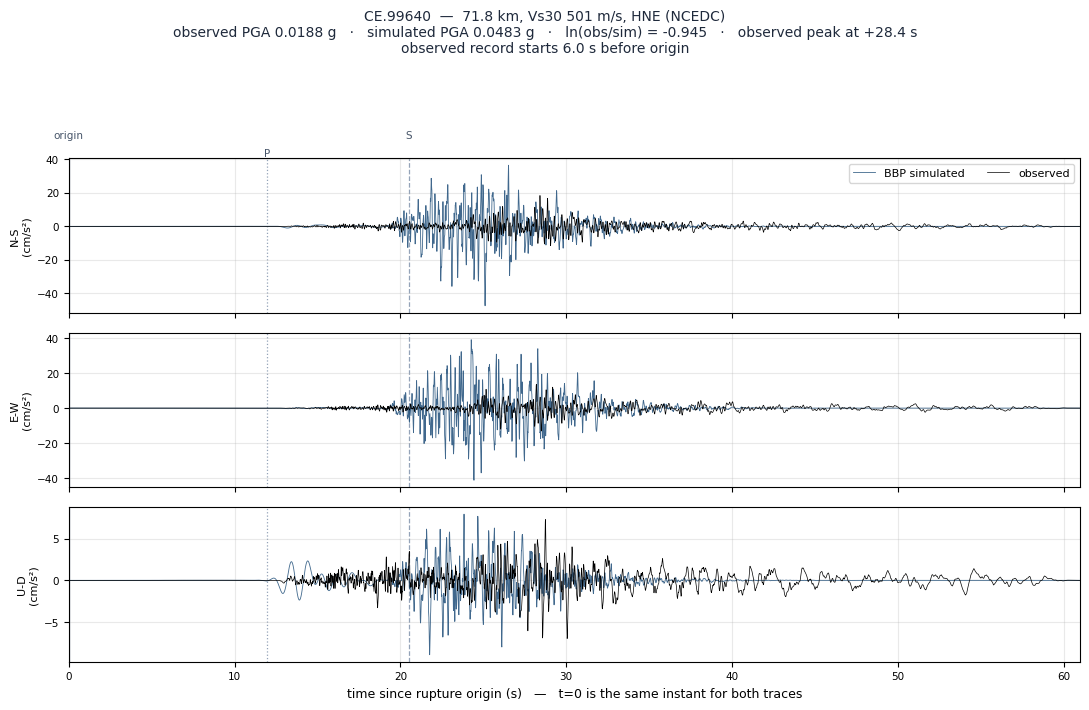
| CE.99640 | 71.8 | 501 | 501 | HNE | 0.0186 | 0.0188 | 0.0483 | 1.2 | 1.4 | 2.9 | 0.63 | 1.06 | 0.60x | -0.945 | — |
| NC.KCSB | 76.8 | 749 | 749 | HNE | 0.0868 | 0.0856 | 0.0374 | 12.7 | 13.5 | 4.0 | 3.29 | 1.60 | 2.06x | +0.828 | — |
| NC.KRP | 78.0 | 732 | 732 | HHE | 0.0199 | 0.0192 | 0.0355 | 1.9 | 1.8 | 1.9 | 1.00 | 0.59 | 1.69x | -0.616 | 1,Outl |
| CE.99700 | 90.5 | 524 | 524 | HNE | 0.0182 | 0.0183 | 0.0419 | 1.2 | 1.3 | 2.6 | 0.34 | 0.67 | 0.51x | -0.828 | — |
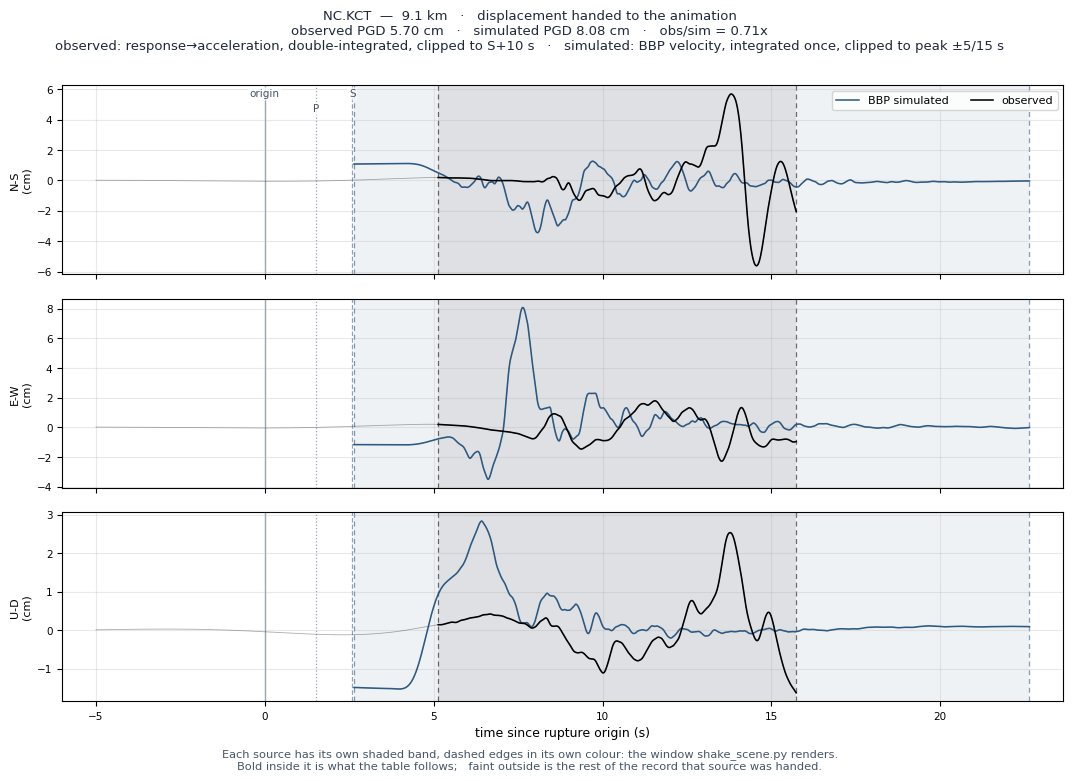
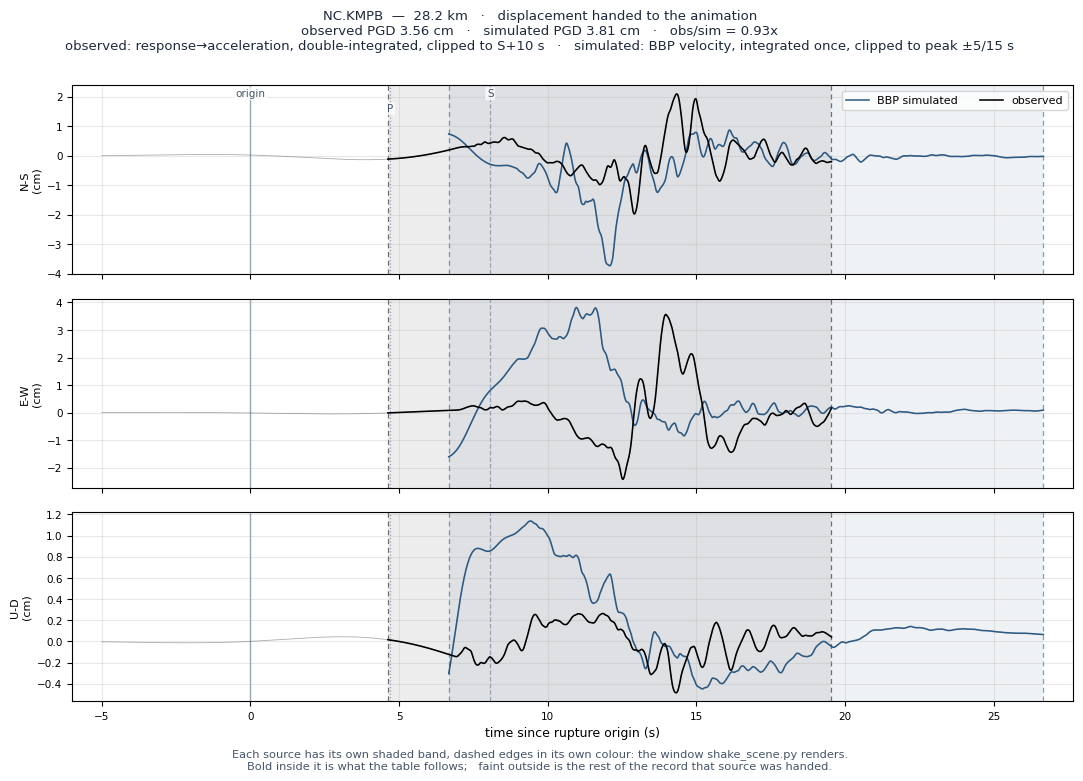
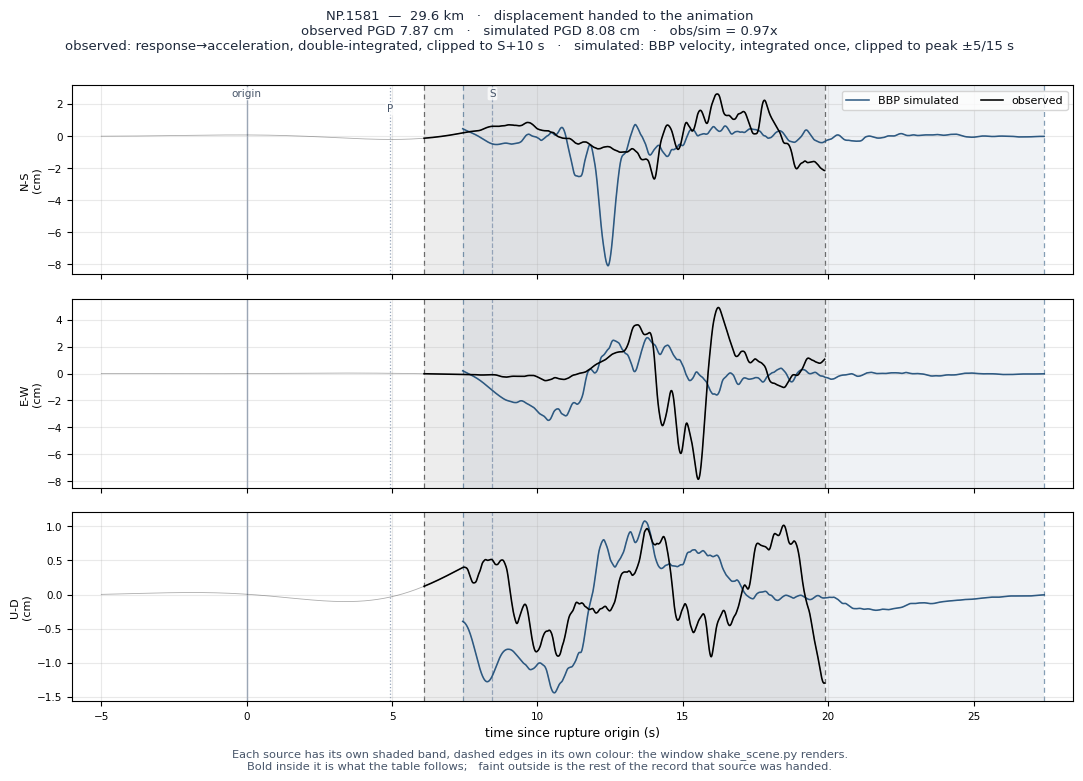
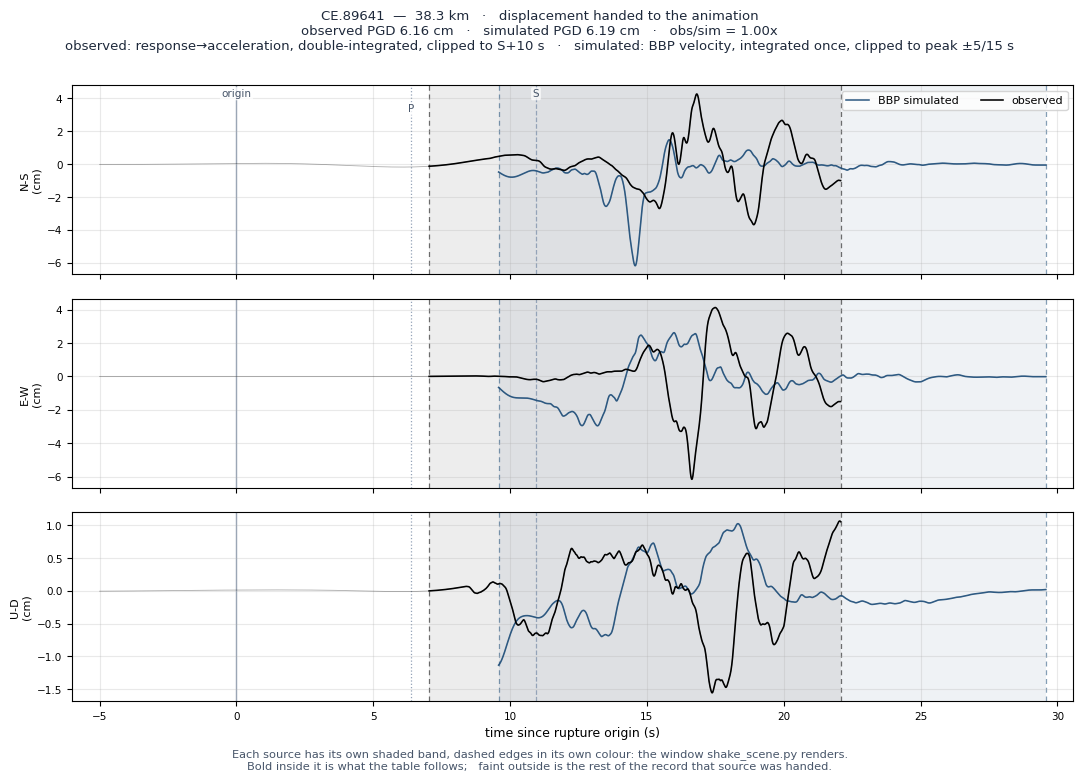
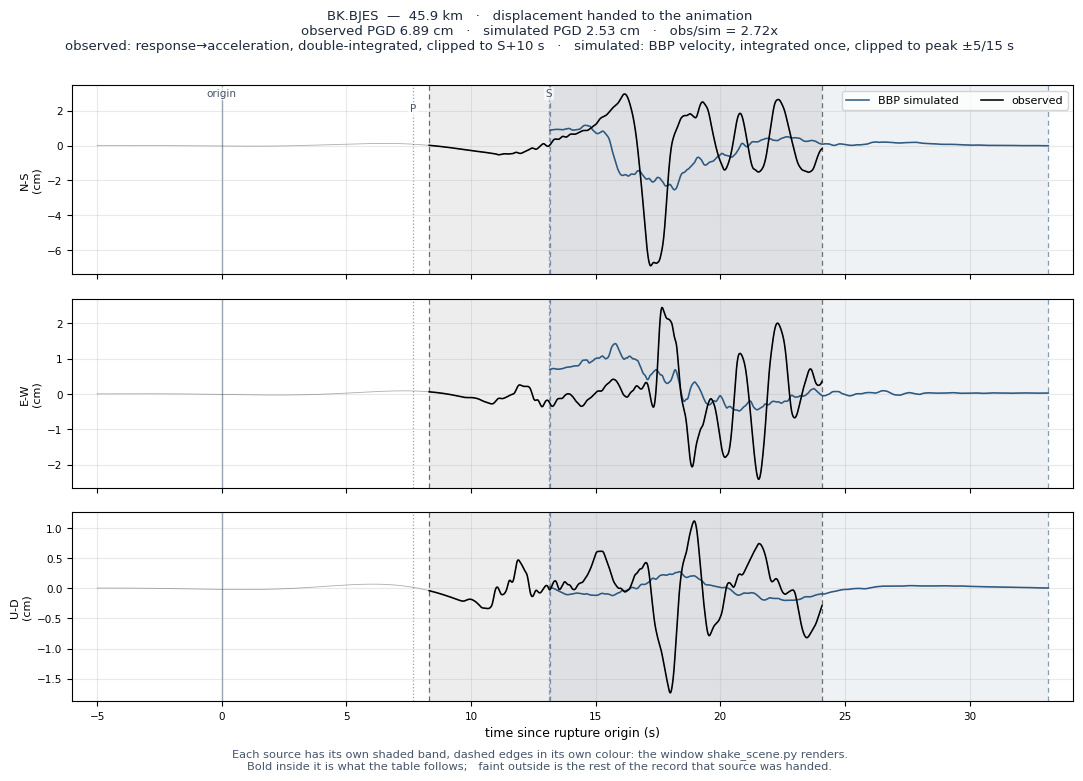
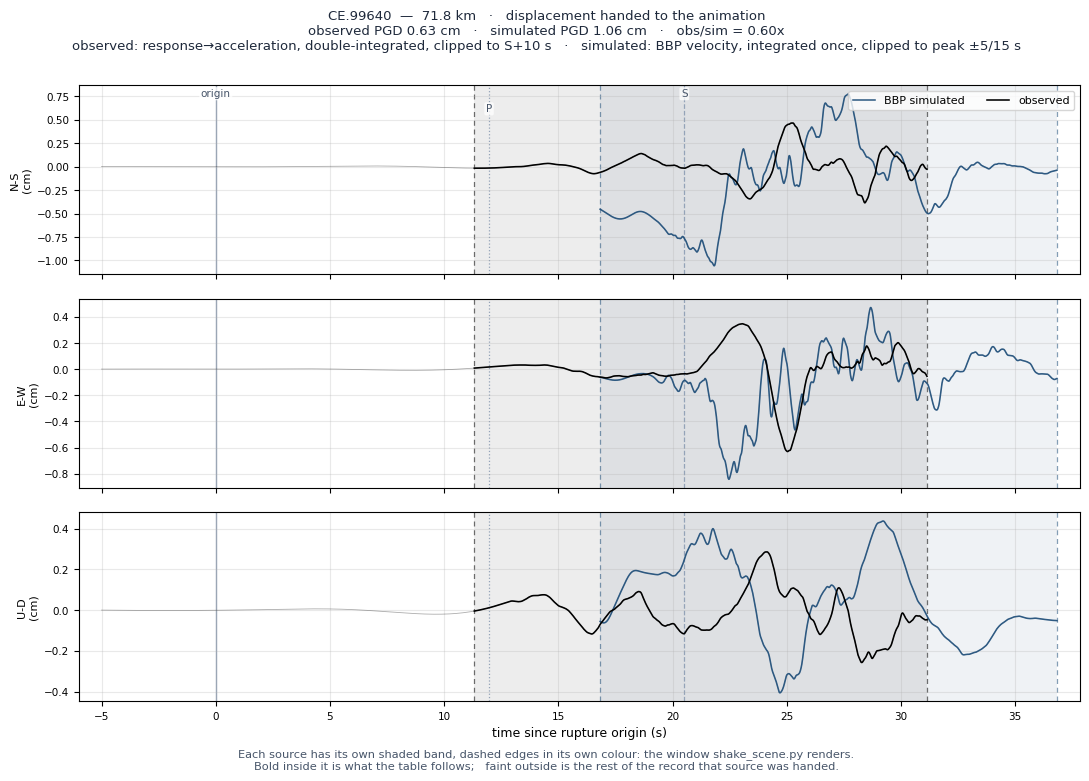
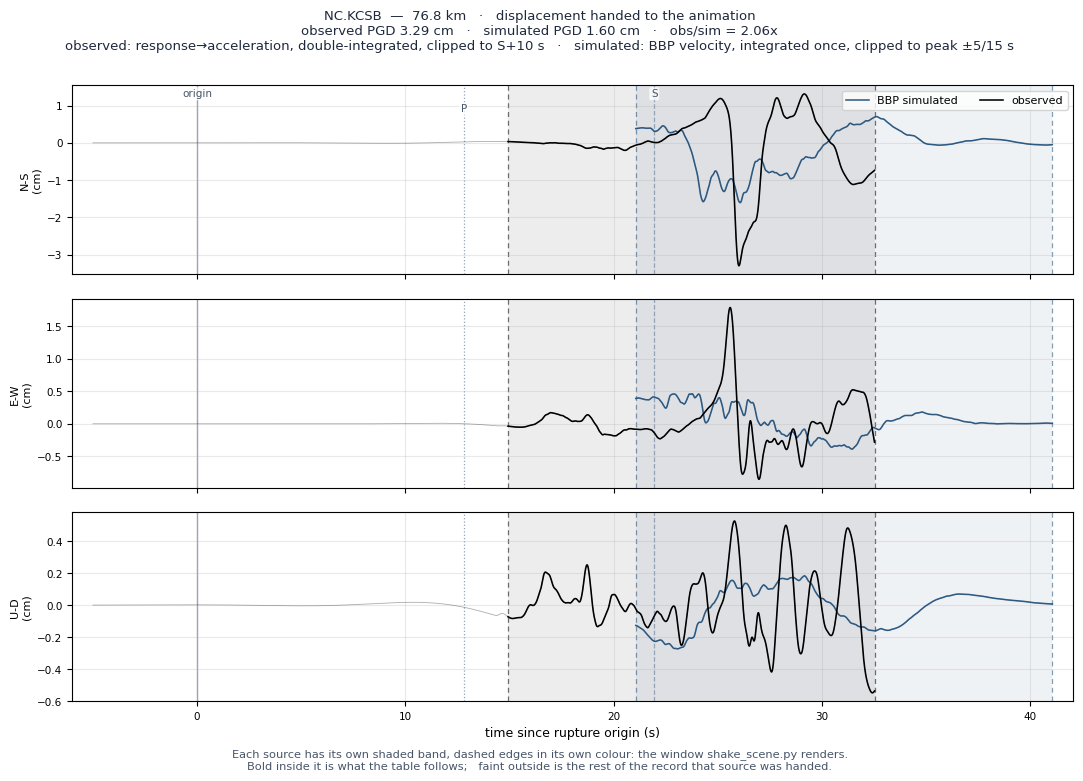
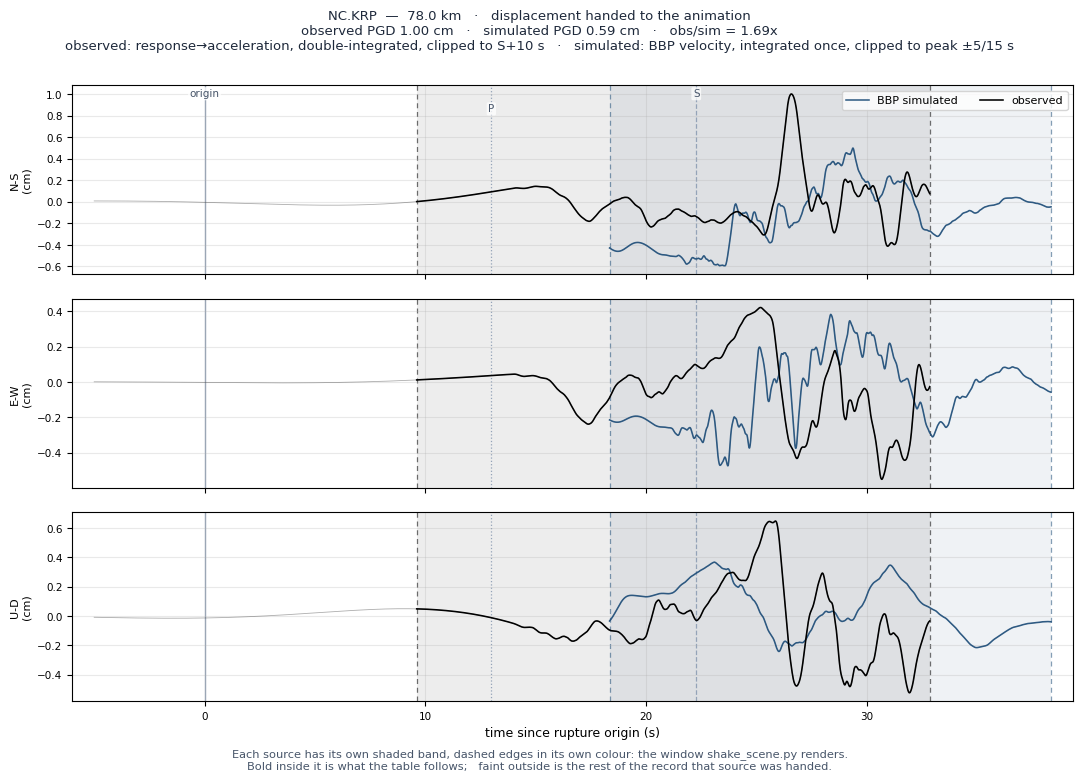
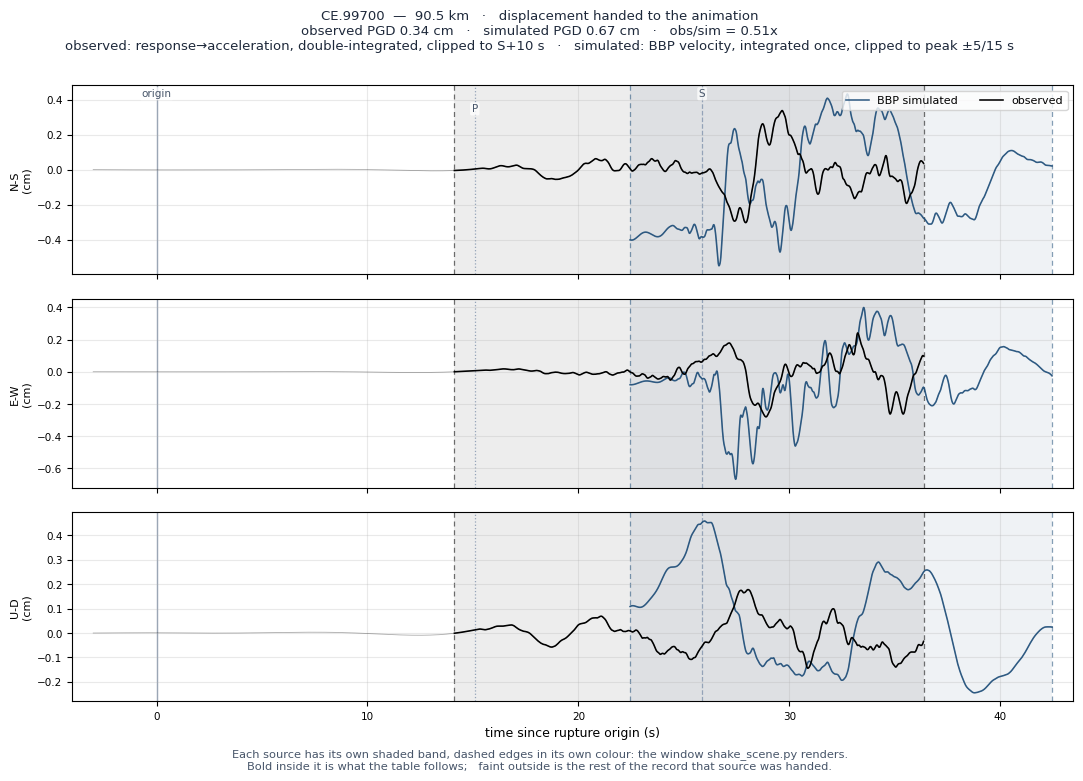
PGD is the animation pipeline's own number on both sides, read from the displacement each side hands to Blender — a different processing chain from the PGA and PGV columns, and from each other. See the displacement pages at the end.
* / Vs30d: 4 of 31 sites were simulated with a Vs30 value repeated across three or more stations — a lookup default rather than a site measurement. Vs30 drives the site term, so a defaulted value produces bias at intermediate and long period that is not the model's fault. Note also that the two Vs30 columns come from different sources and need not agree.
Cross-check — how far apart are the two ‘observed’ sources?
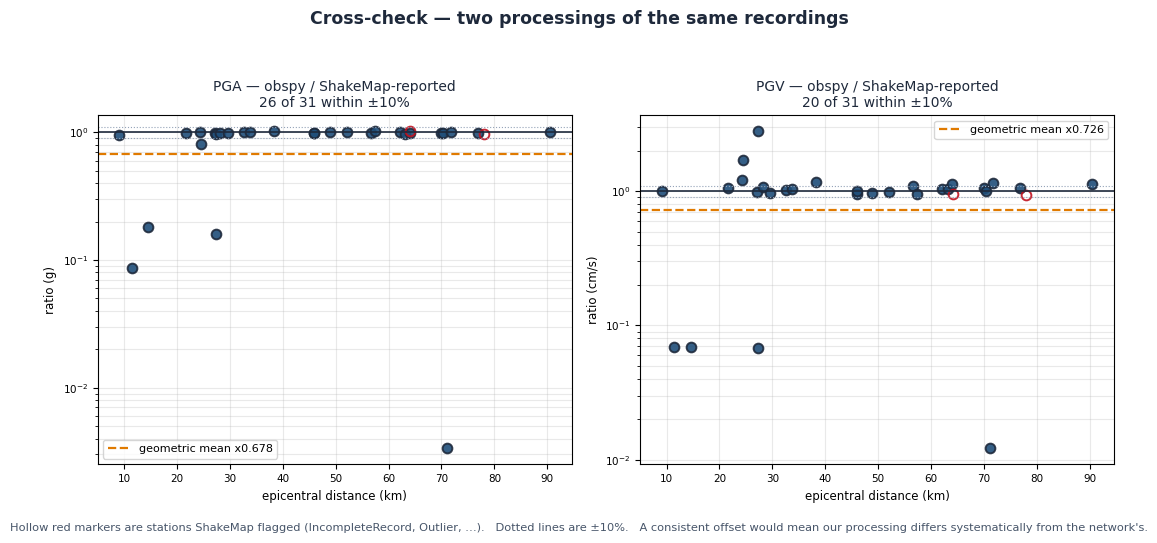
The amplitudes the network reported in ShakeMap against the same recordings re-fetched and processed here. These should agree closely; where they do not, the ShakeMap quality flags usually explain why. A systematic offset here would be a processing fault, not physics.
Residual against distance
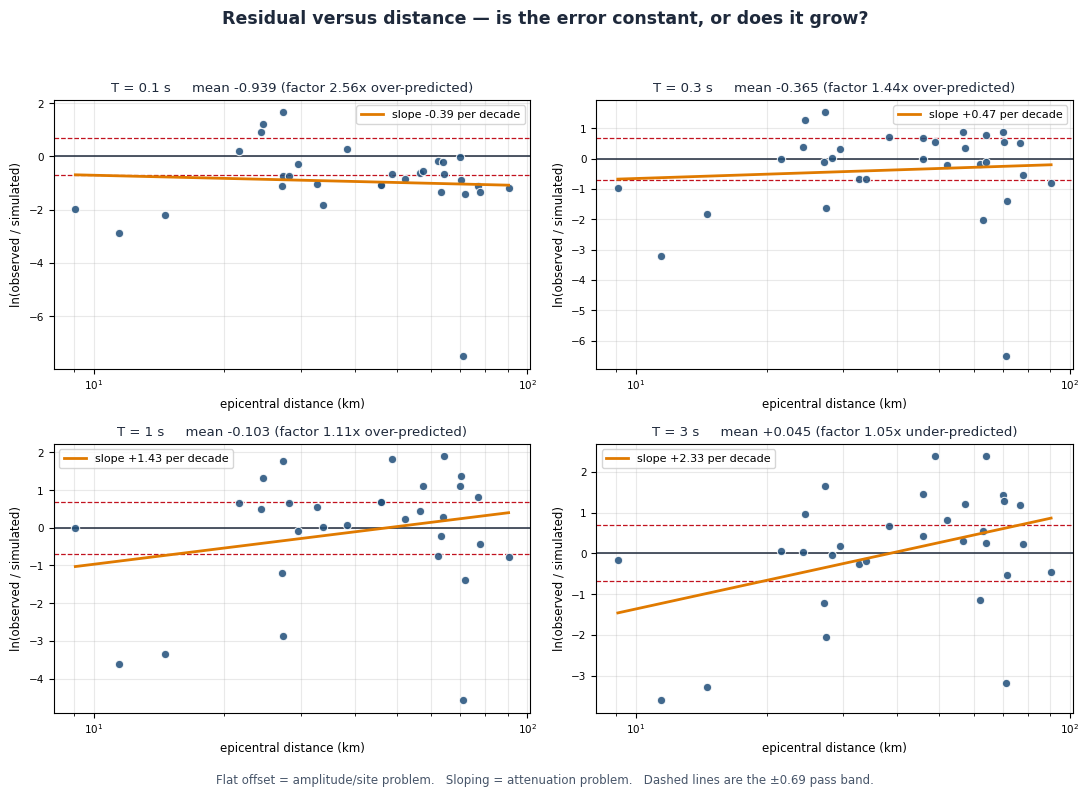
A trend with distance points at the attenuation model rather than the source: the simulation losing energy faster or slower than the real crust does.
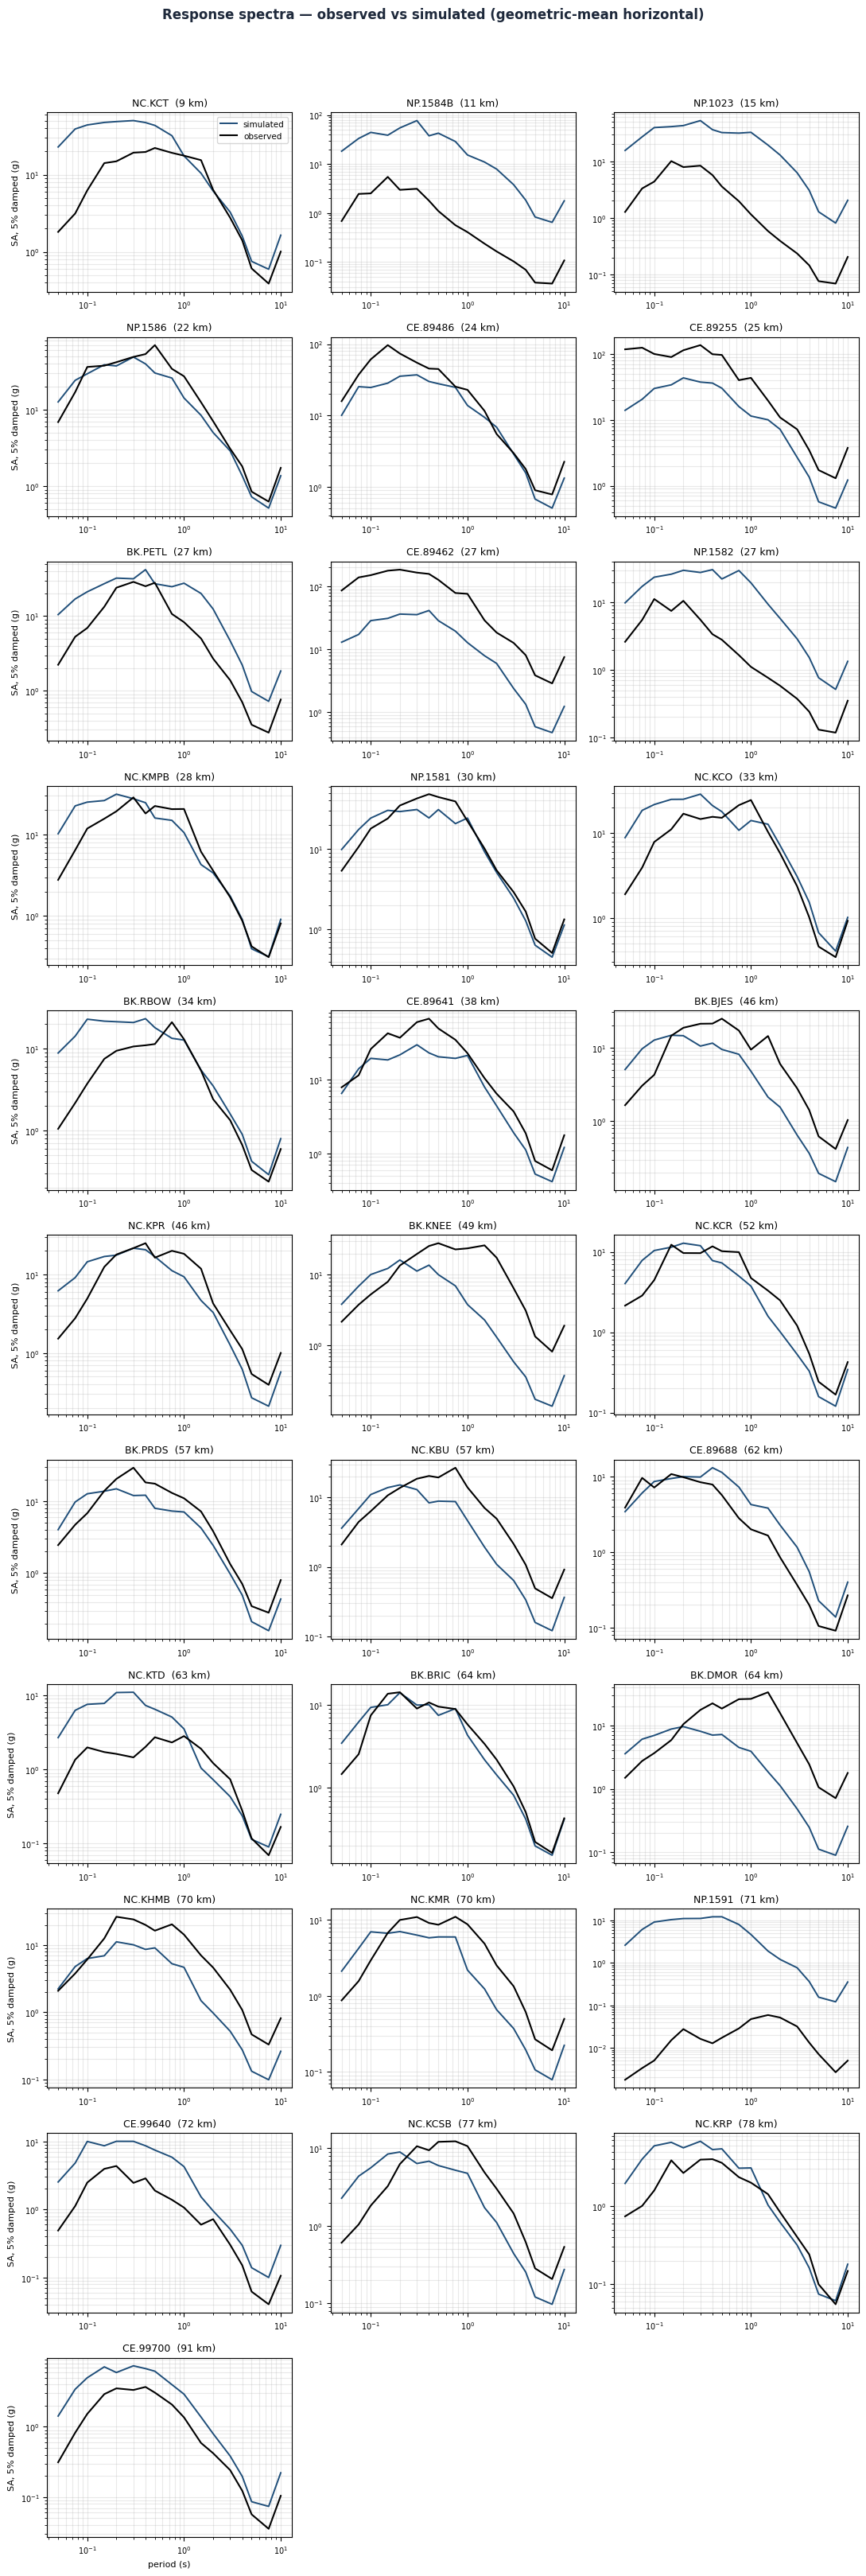
Response spectra, station by station
Observed and simulated response spectra at every compared station.
Per-station detail
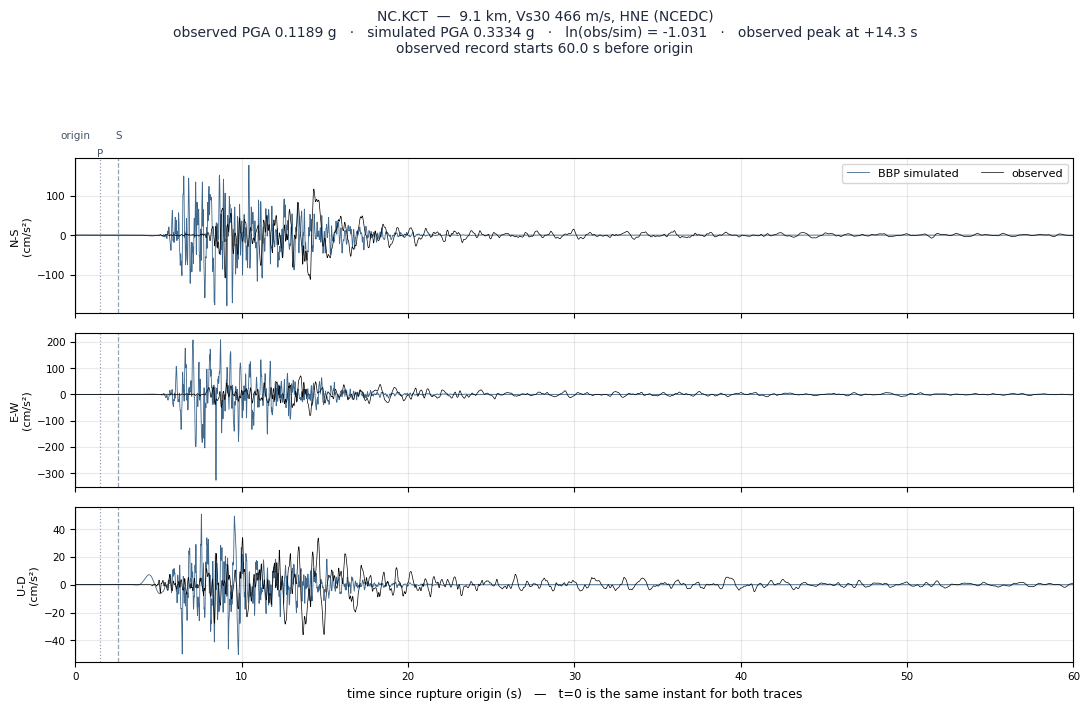
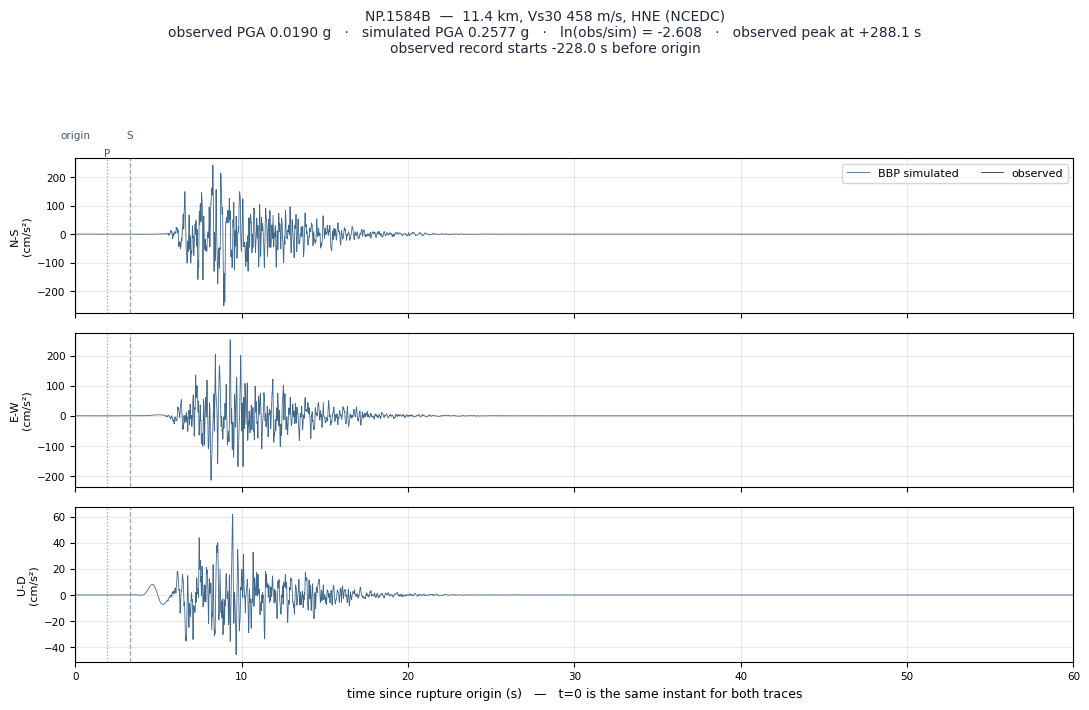
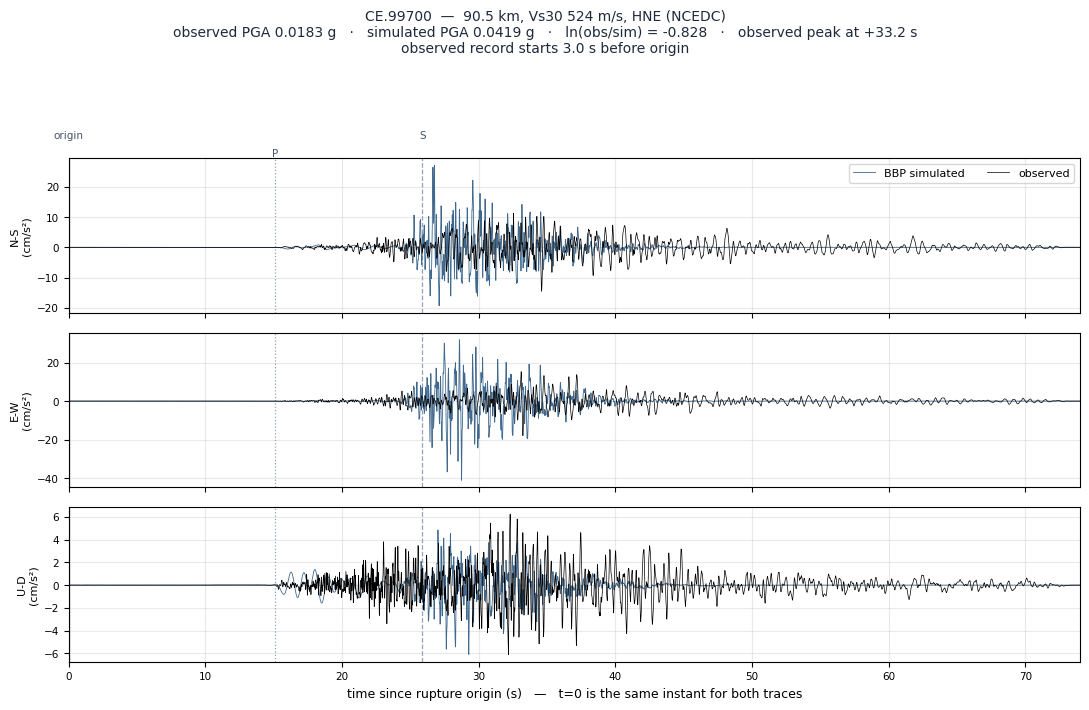
Nearest first. Open a station for its three-component waveform overlay and the displacement record that drives the shaking animations. Figures load when opened.
NC.KCT 9.1 km ln(obs/sim) -1.031
NP.1584B 11.4 km ln(obs/sim) -2.608
NP.1023 14.6 km ln(obs/sim) -2.022
NP.1586 21.6 km ln(obs/sim) +0.407
CE.89486 24.3 km ln(obs/sim) +0.720
CE.89255 24.5 km ln(obs/sim) +1.218
BK.PETL 27.2 km ln(obs/sim) -0.579
CE.89462 27.3 km ln(obs/sim) +2.007
NP.1582 27.4 km ln(obs/sim) -0.875
NC.KMPB 28.2 km ln(obs/sim) -0.228
NP.1581 29.6 km ln(obs/sim) +0.259
NC.KCO 32.7 km ln(obs/sim) -0.033
BK.RBOW 33.8 km ln(obs/sim) -0.293
CE.89641 38.3 km ln(obs/sim) +0.379
BK.BJES 45.9 km ln(obs/sim) +0.538
NC.KPR 46.0 km ln(obs/sim) +0.440
BK.KNEE 48.9 km ln(obs/sim) +1.037
NC.KCR 52.1 km ln(obs/sim) +0.040
BK.PRDS 56.6 km ln(obs/sim) +0.879
NC.KBU 57.4 km ln(obs/sim) +0.838
CE.89688 62.1 km ln(obs/sim) -0.209
NC.KTD 63.1 km ln(obs/sim) -0.871
BK.BRIC 64.0 km ln(obs/sim) +0.214
BK.DMOR 64.1 km ln(obs/sim) +1.517
NC.KHMB 70.0 km ln(obs/sim) +1.016
NC.KMR 70.4 km ln(obs/sim) +0.603
NP.1591 71.1 km ln(obs/sim) -5.250
CE.99640 71.8 km ln(obs/sim) -0.945
NC.KCSB 76.8 km ln(obs/sim) +0.828
NC.KRP 78.0 km ln(obs/sim) -0.616
CE.99700 90.5 km ln(obs/sim) -0.828
Provenance
Simulation
- produced by
- BBP simulated
- BBP job id
- job_d6c24a71669e4cc9b1ff
- BBP version
- 22.4.0
- method
- GP
- realizations
- 1 of 1 succeeded — a single stochastic rupture, not an ensemble; the bias below is one draw
- realization used
- r0001
- sites in job spec
- —
- job submitted
- 2026-08-04T07:15:14Z
- per-site Vs30 from
- submit-time record (/app/plots/gof_work/nc73821036/compare/station_specs.json)
Source parameters
- magnitude used
- —
- hypocentre
- —
- depth
- —
- strike / dip / rake
- —
- mechanism source
- USGS moment tensor, nodal plane 1 — the conjugate plane is equally consistent with the tensor and gives different amplitudes
Velocity model
- region used
- NoCal500
- native for this location
- Mojave500 — not installed, so the run is approximate. LABasin500 carries a deep sedimentary basin that Ridgecrest does not have, which would amplify 0.3-1 s motion.
- calibration
- M6.4 against GP's ~M5.5 floor
- platform
- arm64 under emulation — amplitudes are not SCEC-reference-accurate; this number measures BBP plus Rosetta and cannot separate them
Observed data and processing
Station selection
- search radius
- 100.0 km
- policy
- all usable within radius
- stations on event
- 596
- without FDSN code
- 0 — cannot be queried at all
- candidates
- 31
- usable records
- 31 (0 returned no usable 3-component set)
- in this report
- 31 with both observed and simulated
- distance range
- 9.1 – 90.5 km
Instrumentation
- channel priority
- HN?, EN?, HH?, BH?, EH?
- channels used
- HH, HN
- data centres
- NCEDC
- mixed instrument types
- yes — strong-motion and broadband are both present, which puts a second variable into the residual
- Vs30 source
- ShakeMap stationlist (per-station)
Signal processing
- window
- origin −60.0 s to +300.0 s (requested)
- records not starting as requested
- 11 of 31 — triggered instruments whose data begins later. Each trace's true start is measured and used; assuming the requested lead would misplace them.
- response removal
- to acceleration and velocity separately, pre-filter (0.05, 0.1, 20.0, 25.0) Hz
- resampled to
- 100.0 Hz
- time origin
- t = 0 is the rupture origin for both observed and simulated traces on every overlay
How to read this report
The metric
- definition
- ln(observed / simulated) RotD50 spectral acceleration, averaged across stations at each period.
- sign
- POSITIVE means the simulation under-predicts — real shaking was larger. NEGATIVE means it over-predicts.
- scale
- It is a log ratio: ±0.10 is about ±10%, ±0.69 is a factor of 2, ±1.10 is a factor of 3.
- sigma
- The station-to-station spread around that average. A large sigma with a small bias means the model is right on average and wrong site by site.
Reading the pattern
- short-period poor,
long-period good - Points at high-frequency attenuation or near-surface site response rather than the source.
- long-period poor,
short-period good - Points at the source — corner frequency, stress drop — or at basin response in the velocity model.
- one station far off
- Usually 3D site or directivity effects that a 1D layered velocity model cannot reproduce by construction. Check whether it is driving the sigma before treating it as model error.
What this does not tell you
- A pass means the simulation is consistent with recordings at these stations, for this event, under this velocity model, on this hardware. It is not a general statement about BBP, and it is not a prediction of accuracy at an unrecorded site.