Max Est. MMI
17 km WSW of Toms Place, CA
Ground Shaking Intensities — Interpolated ShakeMap MMI
3 sites| Location | MMI Description |
|---|---|
|
Mammoth Lakes
CA |
Not felt(I) |
|
West Bishop
CA |
Not felt(I) |
|
Dixon Lane-Meadow Creek
CA |
Not felt(I) |
Seismic Station Observed MMI
MMI values are derived directly from observed ground motion measurements at seismic stations and are not spatially interpolated.
| Station | MMI Description |
|---|---|
| Long Valley Fire Station (NP.1576) | Not felt(I) |
| Convict Moraine #3 (NC.MCO) | Weak(II) |
| Mammoth (CI.MLAC) | Weak(II) |
Engineering Ground Motion Parameters
GMPE predictions provide an independent check on the ShakeMap interpolated intensities above.
ShakeMap relies on seismic station recordings; in areas with sparse station coverage — or
for large teleseismic events and earthquakes outside dense West Coast networks — ShakeMap
MMI can be inaccurate. A significant difference between ShakeMap and GMPE estimates is a signal
that the ShakeMap result should be treated as preliminary.
Also includes site Vs30 values and raw ground motion parameters (PGA/PGV).
Show ▼
Engineering Ground Motion Parameters
GMPE predictions provide an independent check on the ShakeMap interpolated intensities above. ShakeMap relies on seismic station recordings; in areas with sparse station coverage — or for large teleseismic events and earthquakes outside dense West Coast networks — ShakeMap MMI can be inaccurate. A significant difference between ShakeMap and GMPE estimates is a signal that the ShakeMap result should be treated as preliminary. Also includes site Vs30 values and raw ground motion parameters (PGA/PGV).
Est. Vs30 Values
Estimated shear-wave velocity in the upper 30 m used in GMPE calculations. Ref. column shows the 760 m/s rock-site reference for comparison.
| Location | Ref. (760 m/s) | Est. Vs30 (m/s) |
|---|---|---|
|
Mammoth Lakes
CA |
760 | 519 |
|
West Bishop
CA |
760 | 352 |
|
Dixon Lane-Meadow Creek
CA |
760 | 294 |
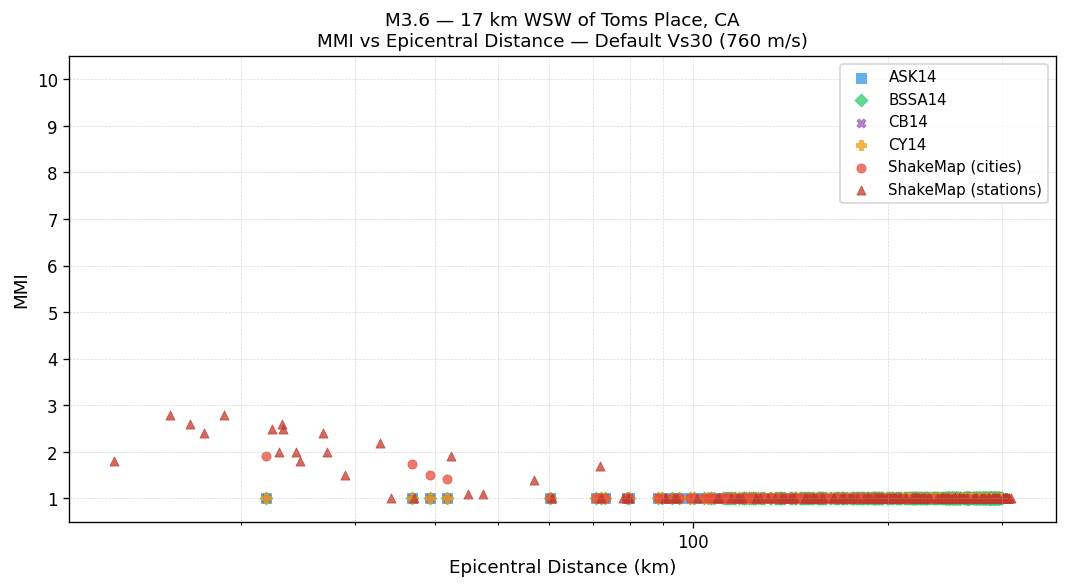
MMI vs Distance — Default Vs30 (760 m/s)
All methods using the 760 m/s rock-site reference. ShakeMap values are independent of Vs30.
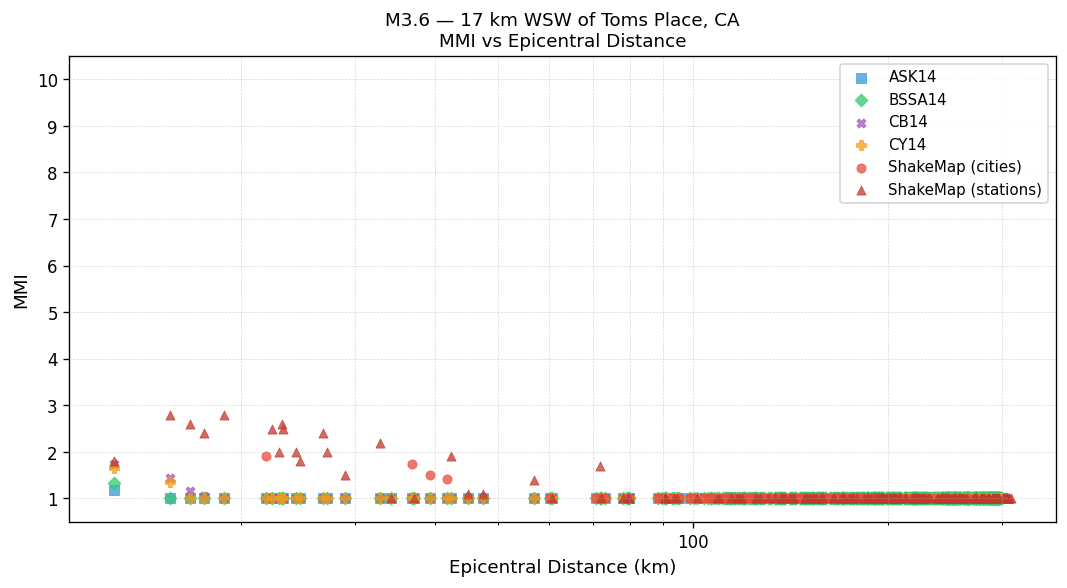
MMI vs Distance — Est. Vs30
GMPEs use the Est. Vs30 values shown in the table above. ShakeMap values are independent of Vs30.
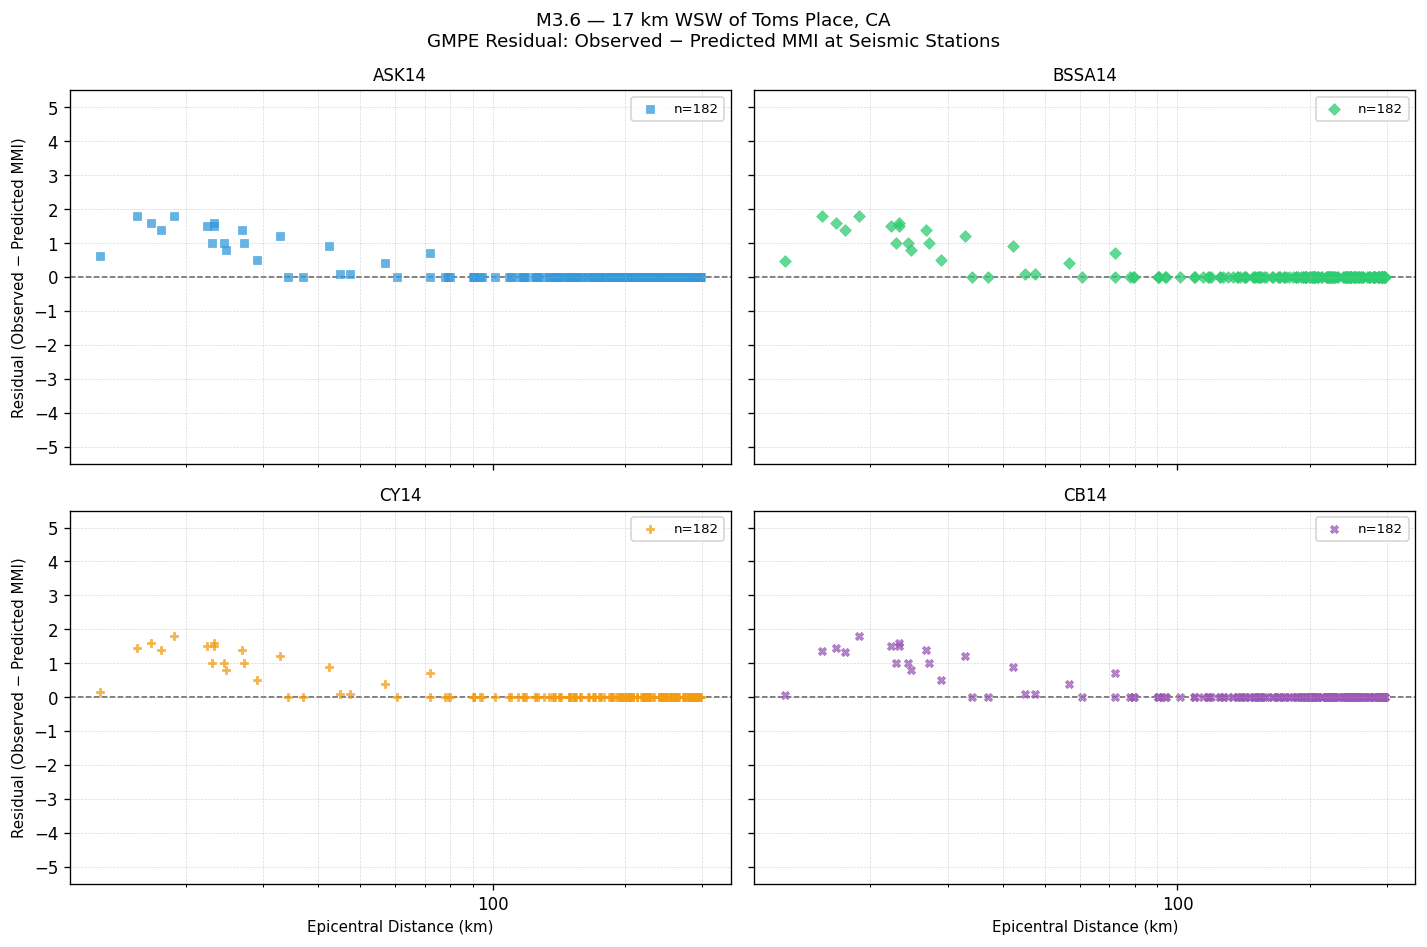
GMPE Residual — Observed − Predicted MMI
Signed residual at each seismic station. Positive values mean the GMPE underestimated shaking; negative values mean it overestimated. The dashed line at zero indicates perfect agreement.
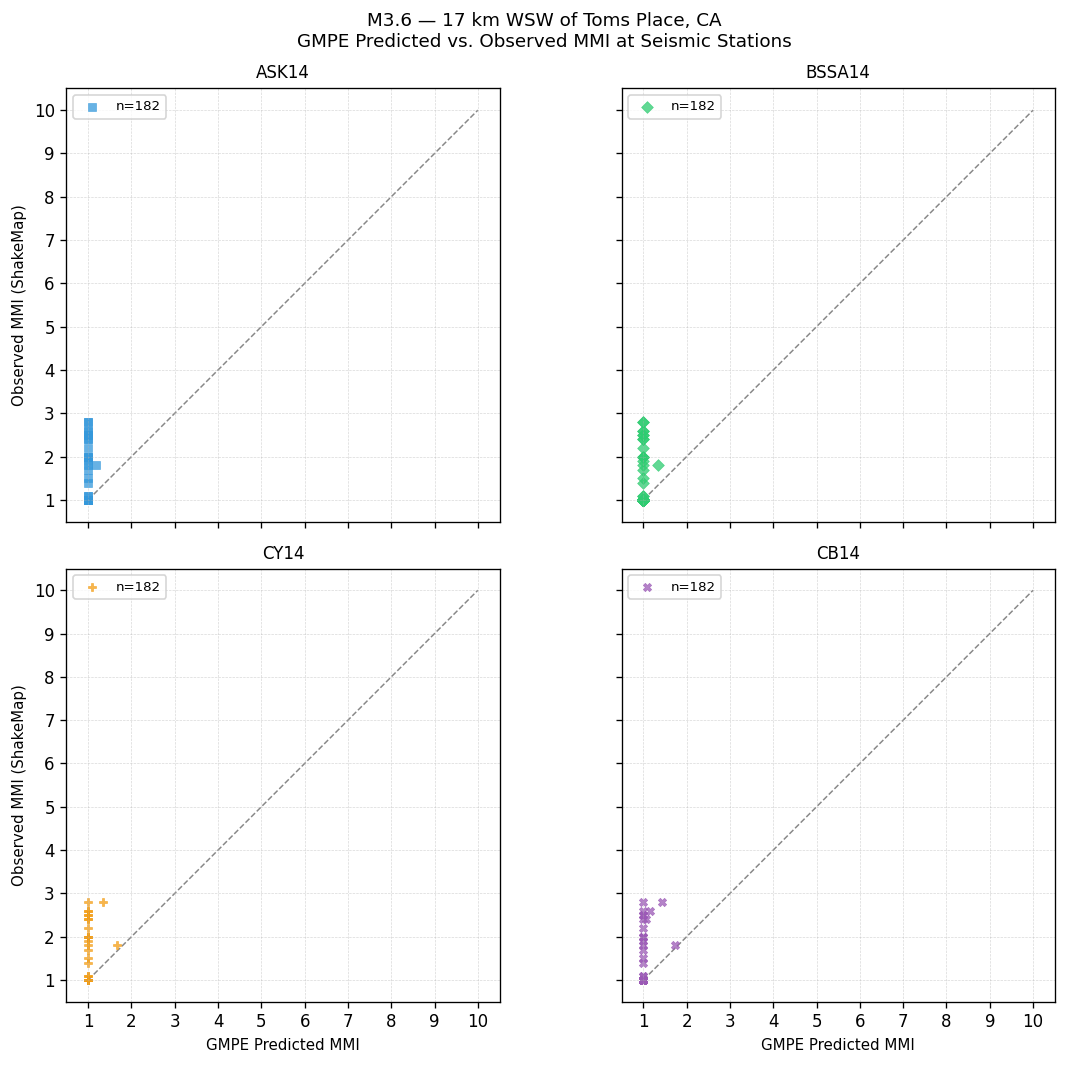
GMPE Predicted vs. Observed MMI at Seismic Stations
Each point is one seismic station. Points on the dashed 1:1 line indicate perfect agreement; above the line = GMPE underestimated shaking; below = overestimated.
GMPE Performance — Station Observations
Statistics computed by comparing each GMPE's predicted MMI against ShakeMap observed MMI at seismic stations. Bias = mean(observed − predicted). Lower RMSE indicates better overall agreement with instrumental measurements.
| GMPE | Bias | Sigma | RMSE |
|---|---|---|---|
| ASK14 | +0.11 | 0.37 | 0.39 |
| BSSA14 | +0.11 | 0.37 | 0.39 |
| CY14 | +0.11 | 0.36 | 0.38 |
| CB14 | +0.11 | 0.35 | 0.37 |
Peak Ground Motion — Seismic Station Observations
Recorded PGA and PGV at seismic stations, sorted by highest PGA. Top 25 stations shown. MMI (PGA) and MMI (PGV) are independent conversions via Worden et al. (2012) GMICE.
| Station | PGA (g) | MMI (PGA) | PGV (cm/s) | MMI (PGV) |
|---|---|---|---|---|
| Convict Moraine #3 (NC.MCO) | 0.0122 | Weak(II) | 0.152 | Weak(II) |
| Casa Benchmark (NC.MCB) | 0.0090 | Weak(II) | 0.141 | Weak(II) |
| East Mammoth (NC.MEM) | 0.0056 | Not felt(I) | 0.098 | Weak(II) |
| Lincoln Peak (NC.MLI) | 0.0053 | Not felt(I) | 0.093 | Weak(II) |
| Devils Postpile (NC.MDPB) | 0.0051 | Not felt(I) | 0.076 | Weak(II) |
| Doe Ridge #3 (NC.MDR) | 0.0045 | Not felt(I) | 0.076 | Weak(II) |
| Mammoth Lakes Knolls (NC.MMLB) | 0.0038 | Not felt(I) | 0.112 | Weak(II) |
| Mammoth (CI.MLAC) | 0.0032 | Not felt(I) | 0.105 | Weak(II) |
| Fire Station (NP.1679) | 0.0029 | Not felt(I) | 0.041 | Not felt(I) |
| Mammoth Hole surface (NC.MDH) | 0.0027 | Not felt(I) | 0.047 | Not felt(I) |
| Long Valley Fire Station (NP.1576) | 0.0024 | Not felt(I) | 0.037 | Not felt(I) |
| Mammoth Mtn McCoy #2 (NC.MCY) | 0.0023 | Not felt(I) | 0.048 | Not felt(I) |
| Minaret Summit (NC.MINS) | 0.0020 | Not felt(I) | 0.047 | Not felt(I) |
| Chidago Canyon (NC.MCC) | 0.0020 | Not felt(I) | 0.059 | Weak(II) |
| Highway Maintenance Yard (NP.2021) | 0.0016 | Not felt(I) | 0.035 | Not felt(I) |
| Dry Creek (NC.MDY) | 0.0013 | Not felt(I) | 0.037 | Not felt(I) |
| White Mountain Estates (NC.MWE) | 0.0013 | Not felt(I) | 0.018 | Not felt(I) |
| Lookout Mountain (NC.MLMB) | 0.0011 | Not felt(I) | 0.028 | Not felt(I) |
| Owens Valley Radio Observatory, Big Pine, CA (BK.OVRO) | 0.0007 | Not felt(I) | 0.025 | Not felt(I) |
| Patterson Mtn (BK.PATT) | 0.0007 | Not felt(I) | 0.017 | Not felt(I) |
| UCLA Research Station (NP.1589) | 0.0007 | Not felt(I) | 0.019 | Not felt(I) |
| Five Bridges (NC.MFBB) | 0.0006 | Not felt(I) | 0.016 | Not felt(I) |
| Miami Mountain, Sierra National Forest, Mariposa County (BK.MMI) | 0.0006 | Not felt(I) | 0.011 | Not felt(I) |
| Bear Mountain (NC.MBEB) | 0.0006 | Not felt(I) | 0.008 | Not felt(I) |
| Rademacher Property, Miramonte, CA, USA (BK.HELL) | 0.0005 | Not felt(I) | 0.013 | Not felt(I) |