Observed vs Simulated — Goodness of Fit
A physics-based simulation of this earthquake, compared against the seismograms the network actually recorded. M5.59 11 km N of Redwood Valley, CA · 2026-06-24 15:10:40 UTC
Before reading the result
What this measurement does and does not establish.
Emulated hardware. The simulation ran on arm64 under emulation. Amplitudes are not SCEC-reference-accurate, and this measurement cannot separate the platform from the model.
One realization. A single stochastic rupture, not an ensemble. The bias below is one draw; a second run with a different seed would give a different number.
What a pass means. Consistency with recordings at these 40 stations, for this event, under this velocity model, on this hardware, within a factor of 1.99. It is not a general statement about BBP and not a prediction of accuracy at an unrecorded site.
Result
- mean |bias|
- 0.370
- a factor of 1.45×
- pass band
- 0.69
- a factor of 1.99×, declared before the run
- sigma
- 0.577
- station-to-station scatter
- cross-check
- 0.446
- recomputed here from the waveforms
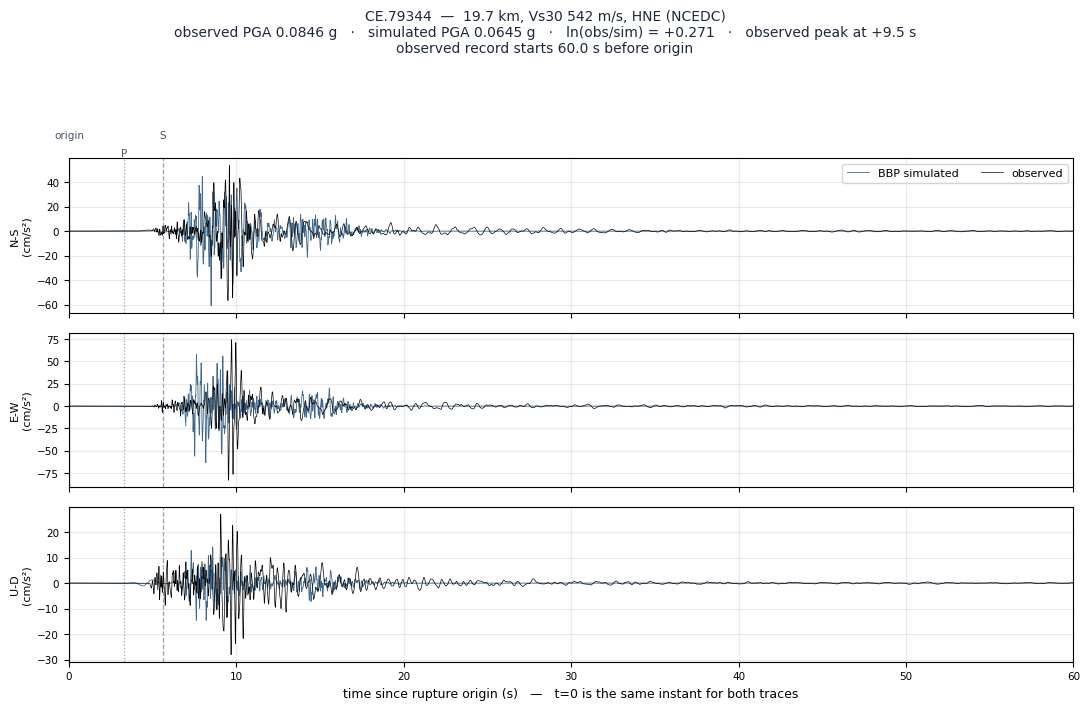
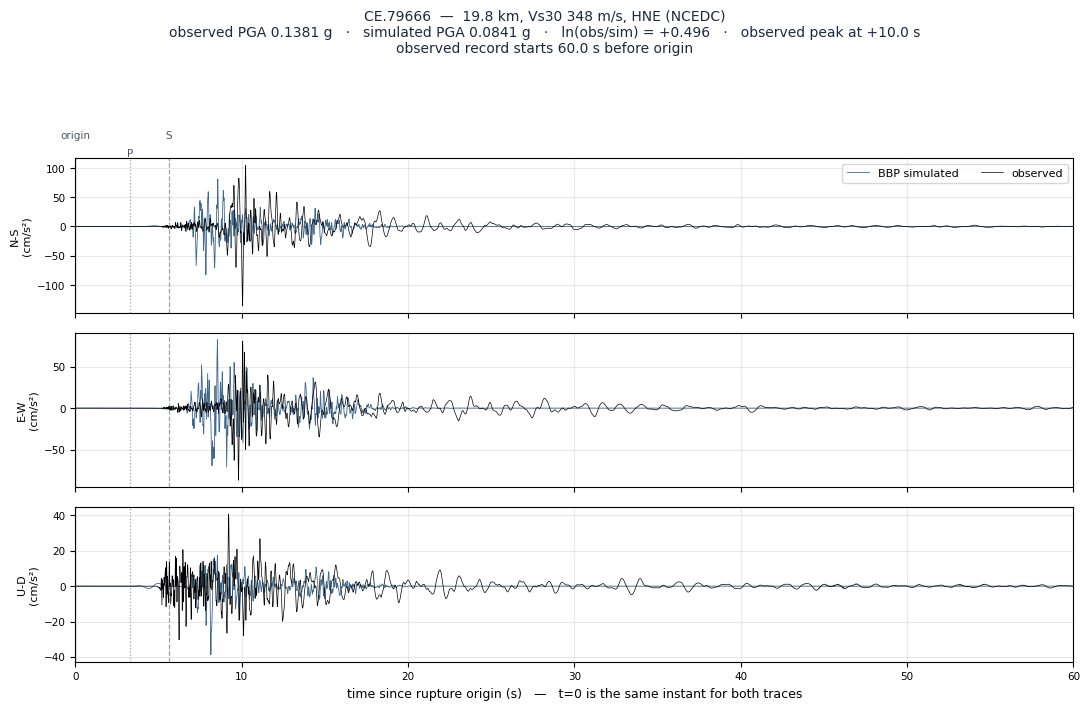
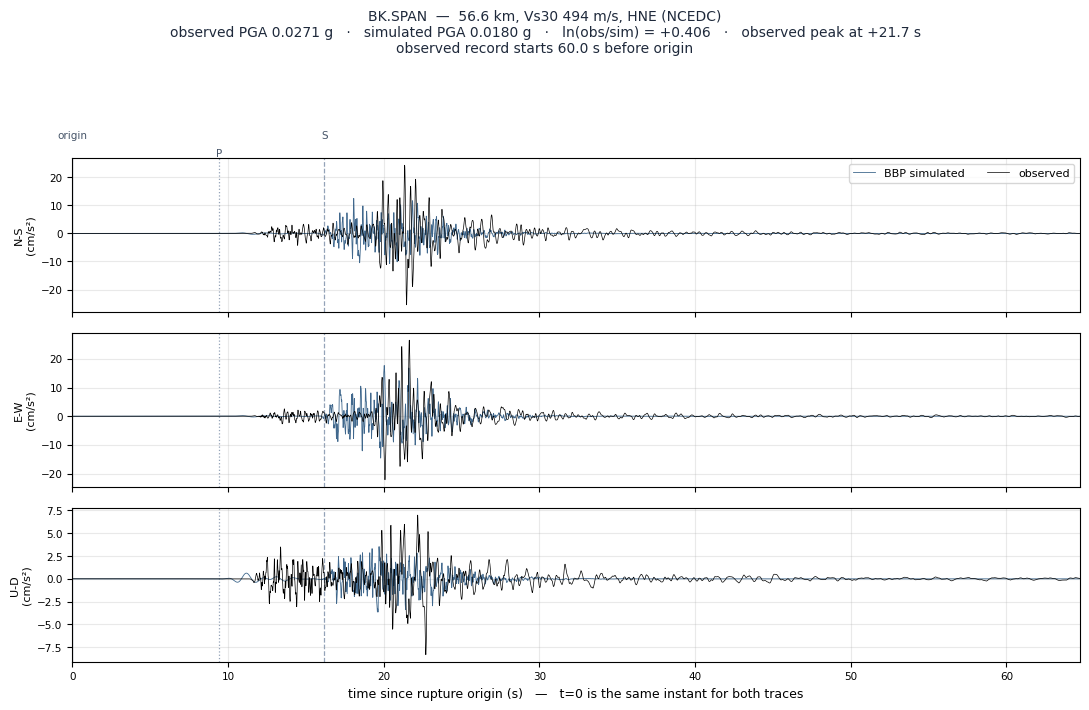
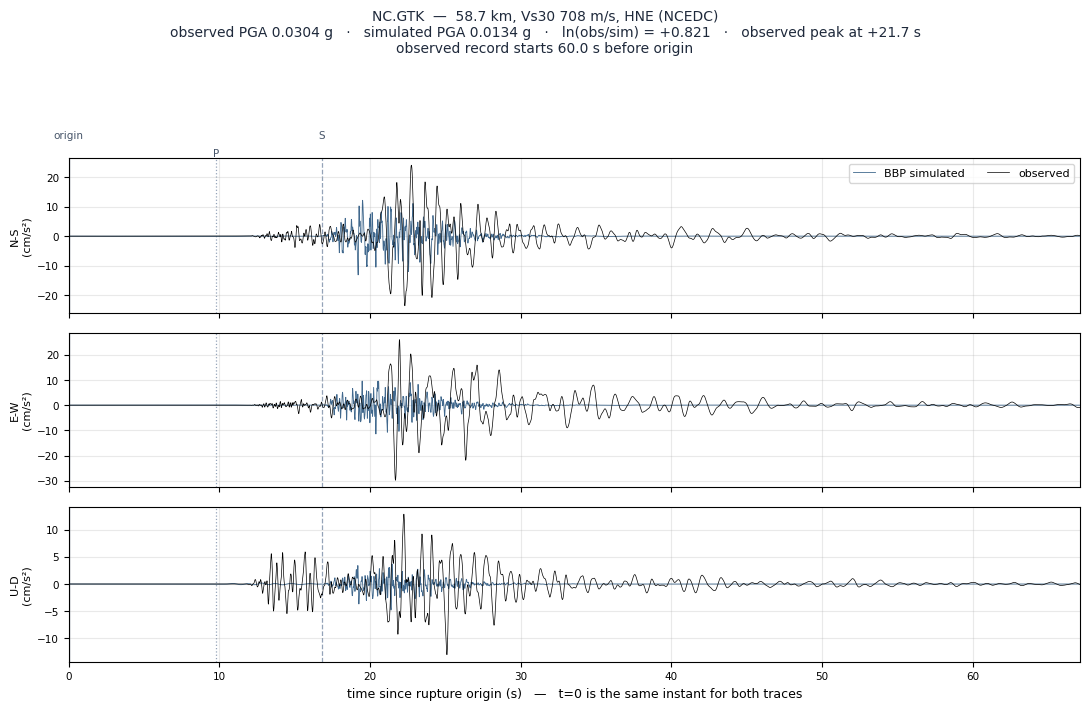
The metric is ln(observed / simulated) RotD50 spectral acceleration, averaged over stations. Positive means the simulation under-predicts — real shaking was larger. Basis: BBP RotD50 residuals (authoritative).
Residual by period
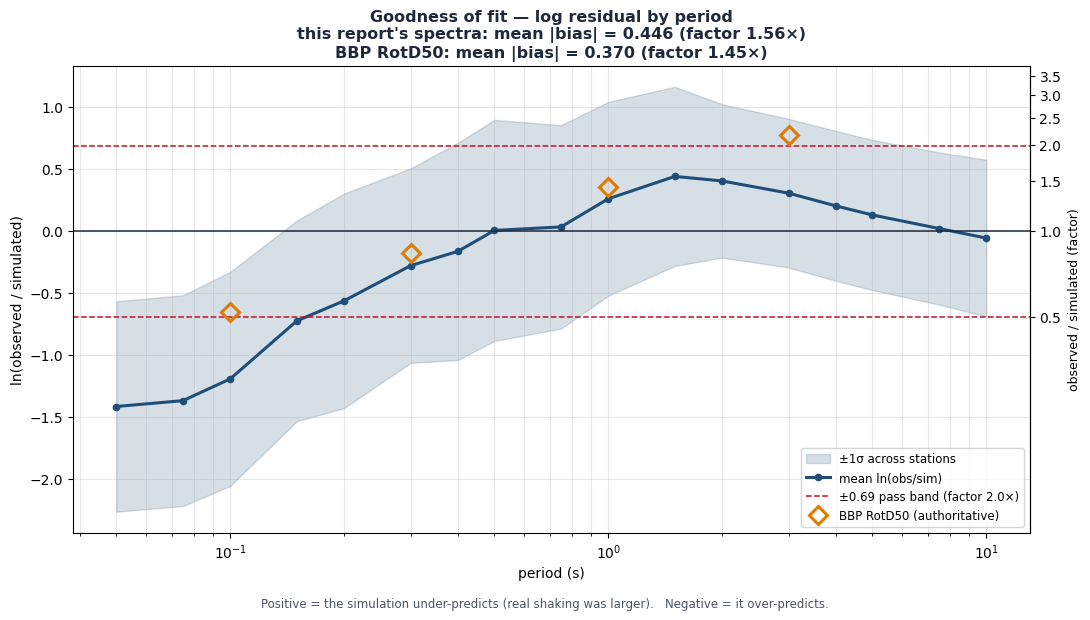
Mean ln(obs/sim) at each spectral period. A structure responds at its own period, so agreement at one period says nothing about another.
| Period | Bias | Simulation | vs. band |
|---|---|---|---|
| 0.1s | -0.655 | over-predicts by 93% | within |
| 0.3s | -0.177 | over-predicts by 19% | within |
| 1s | +0.354 | under-predicts by 42% | within |
| 3s | +0.775 | under-predicts by 117% | outside band |
Goodness of fit across the spectrum
Mean residual with its ±1σ band, against the pass band. Diamonds are the Broadband Platform’s own RotD50 residuals; the line is this report’s independent recomputation from the waveforms.
Where the stations are
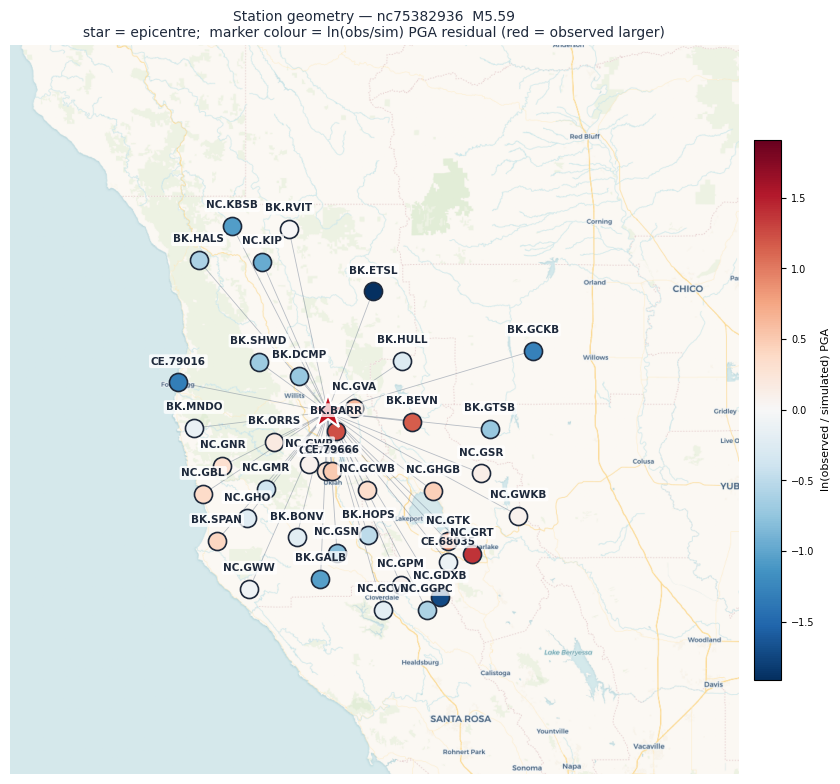
Each station coloured by its PGA residual. Red means the simulation under-predicted the recording; blue means it over-predicted.
Station summary — three independent sources
40 stations with both a recording and a simulated seismogram. Scroll sideways for the full set of columns.
| Station | Dist (km) |
Vs30 BBP |
Vs30 ShakeMap |
Chan | PGA (g) ShakeMap |
PGA (g) obspy |
PGA (g) BBP |
PGV (cm/s) ShakeMap |
PGV (cm/s) obspy |
PGV (cm/s) BBP |
PGD (cm) obspy |
PGD (cm) BBP |
PGD obs/sim |
ln(obs/ sim) |
Flags |
|---|---|---|---|---|---|---|---|---|---|---|---|---|---|---|---|
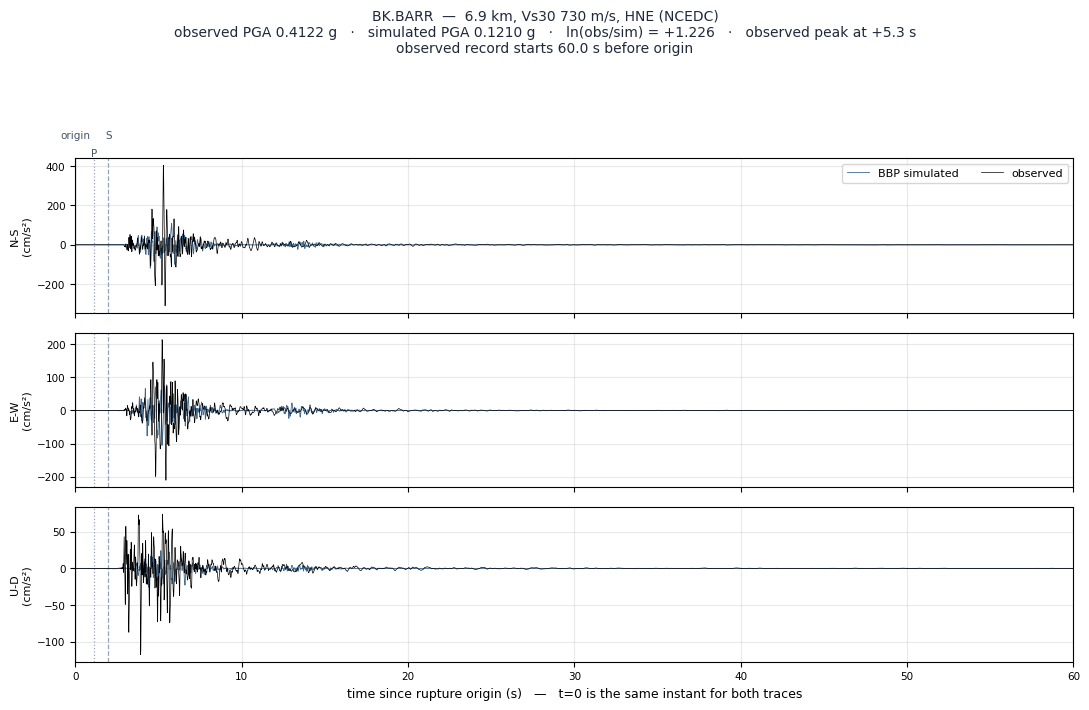
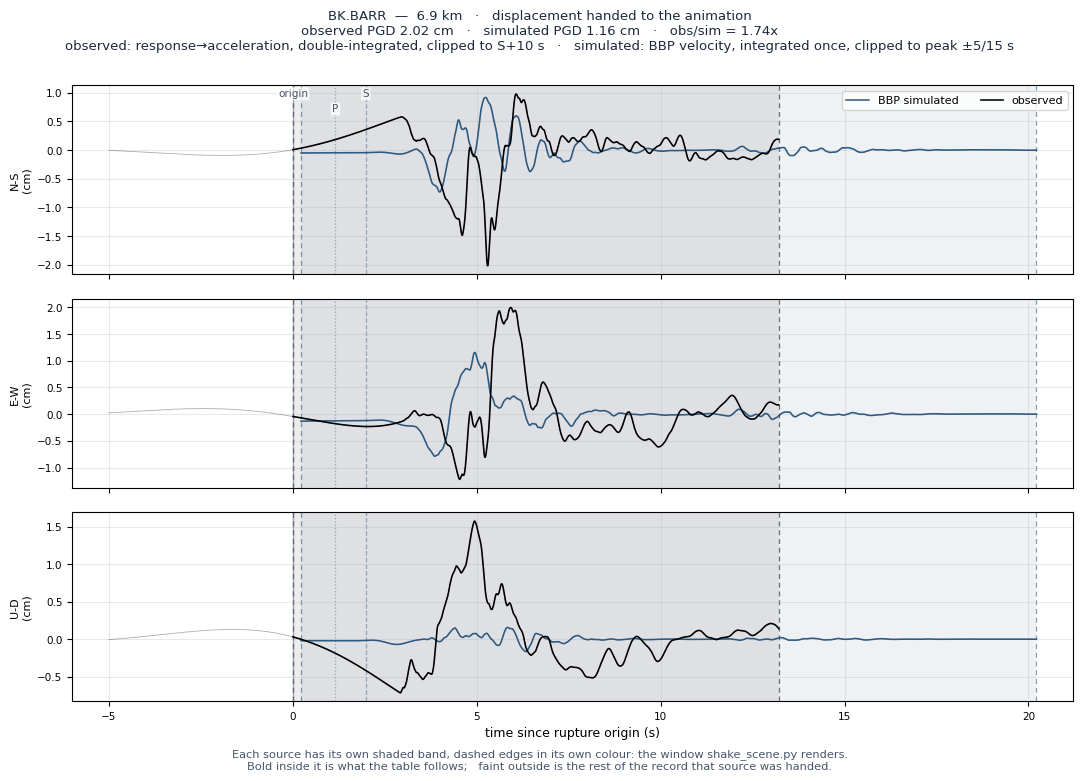
| BK.BARR | 6.9 | 730 | 730 | HNE | 0.4188 | 0.4122 | 0.1210 | 14.1 | 15.3 | 5.9 | 2.02 | 1.16 | 1.74x | +1.226 | — |
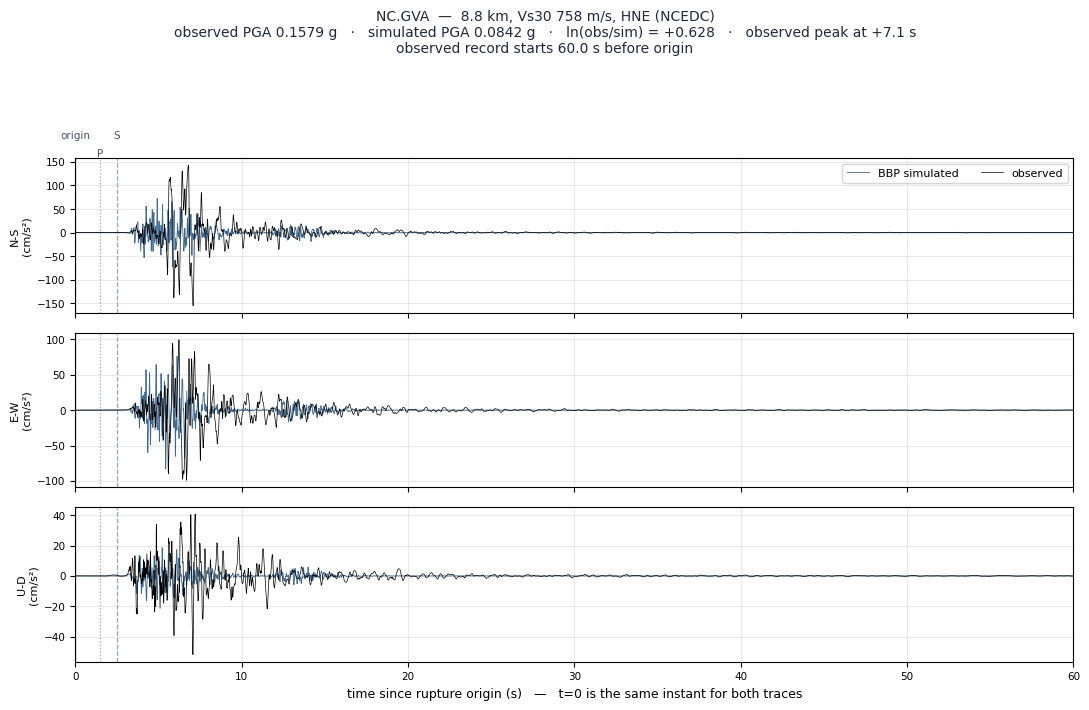
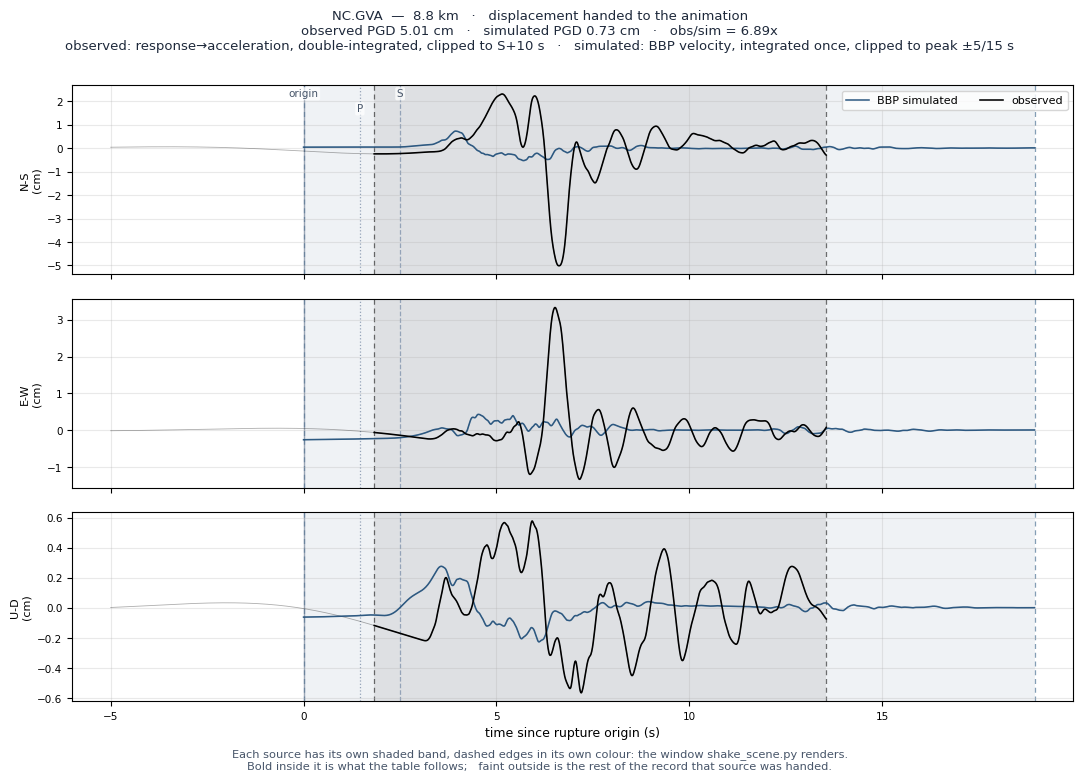
| NC.GVA | 8.8 | 758 | 758 | HNE | 0.1586 | 0.1579 | 0.0842 | 22.9 | 22.7 | 3.6 | 5.01 | 0.73 | 6.89x | +0.628 | — |
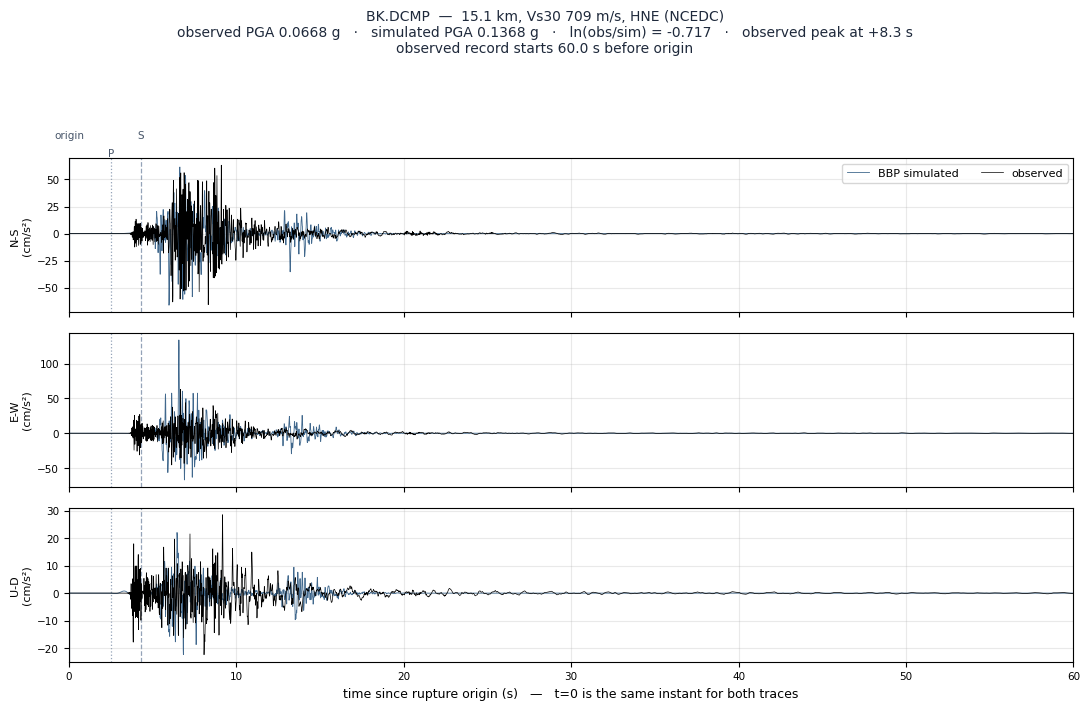
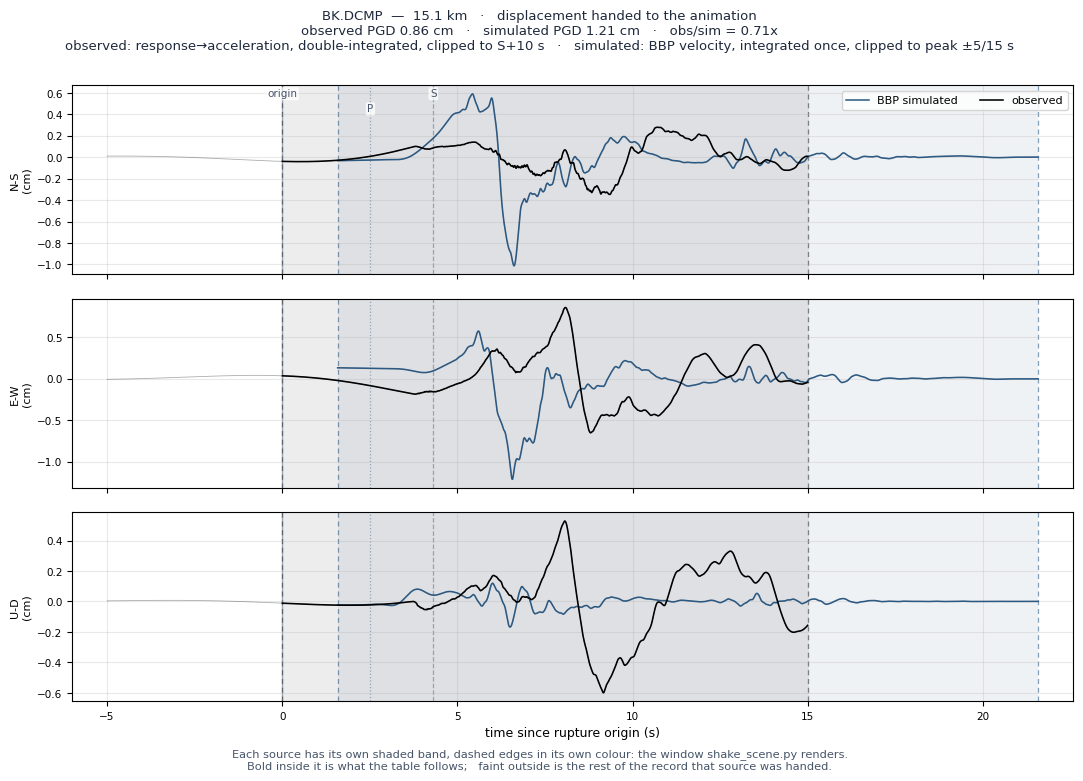
| BK.DCMP | 15.1 | 709 | 709 | HNE | 0.1026 | 0.0668 | 0.1368 | 3.5 | 3.3 | 5.4 | 0.86 | 1.21 | 0.71x | -0.717 | — |
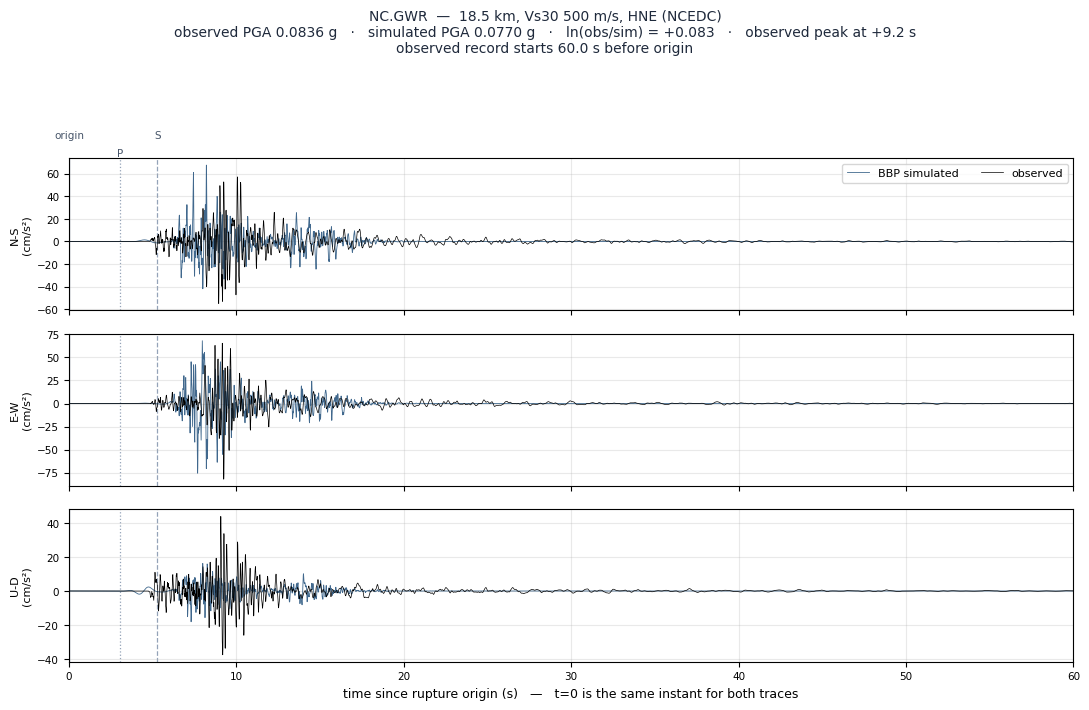
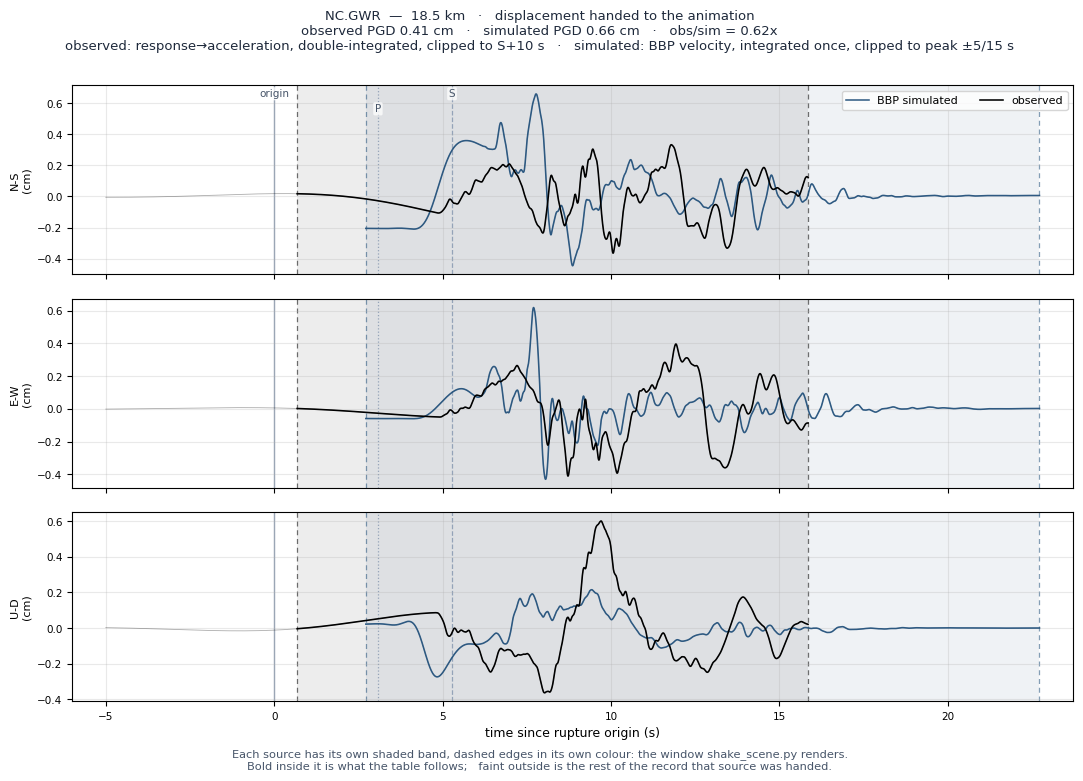
| NC.GWR | 18.5 | 500 | 500 | HNE | 0.0867 | 0.0836 | 0.0770 | 2.9 | 2.9 | 5.5 | 0.41 | 0.66 | 0.62x | +0.083 | — |
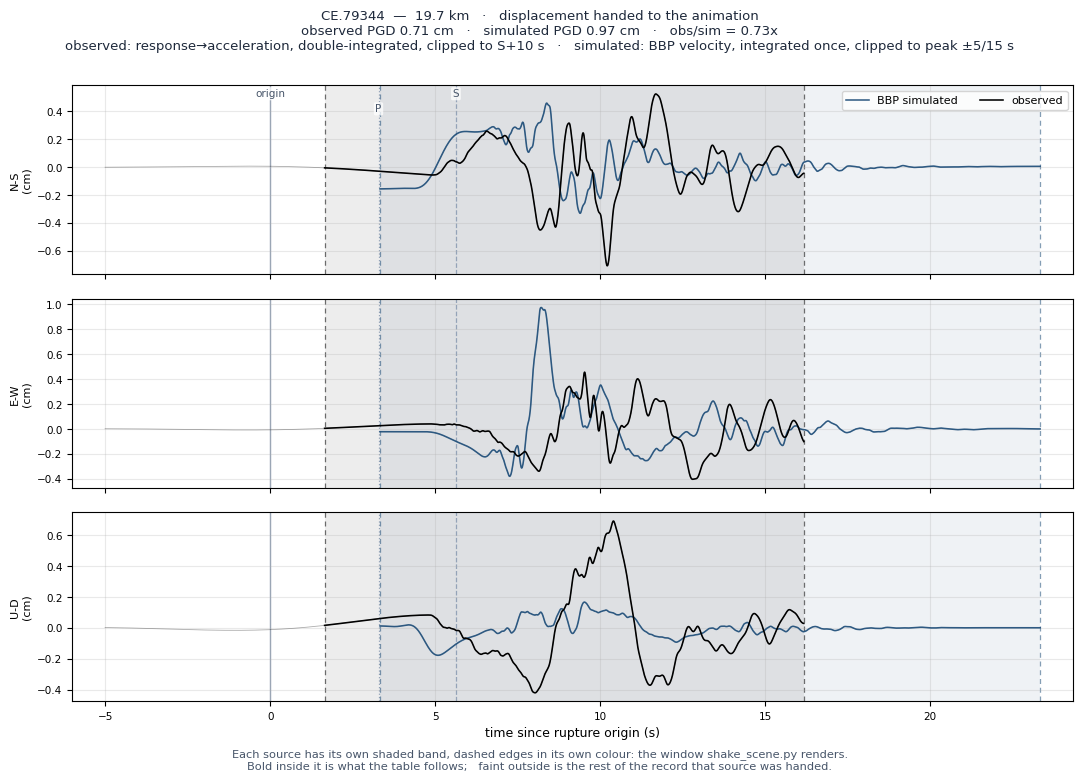
| CE.79344 | 19.7 | 542 | 542 | HNE | 0.0853 | 0.0846 | 0.0645 | 3.0 | 3.0 | 4.2 | 0.71 | 0.97 | 0.73x | +0.271 | — |
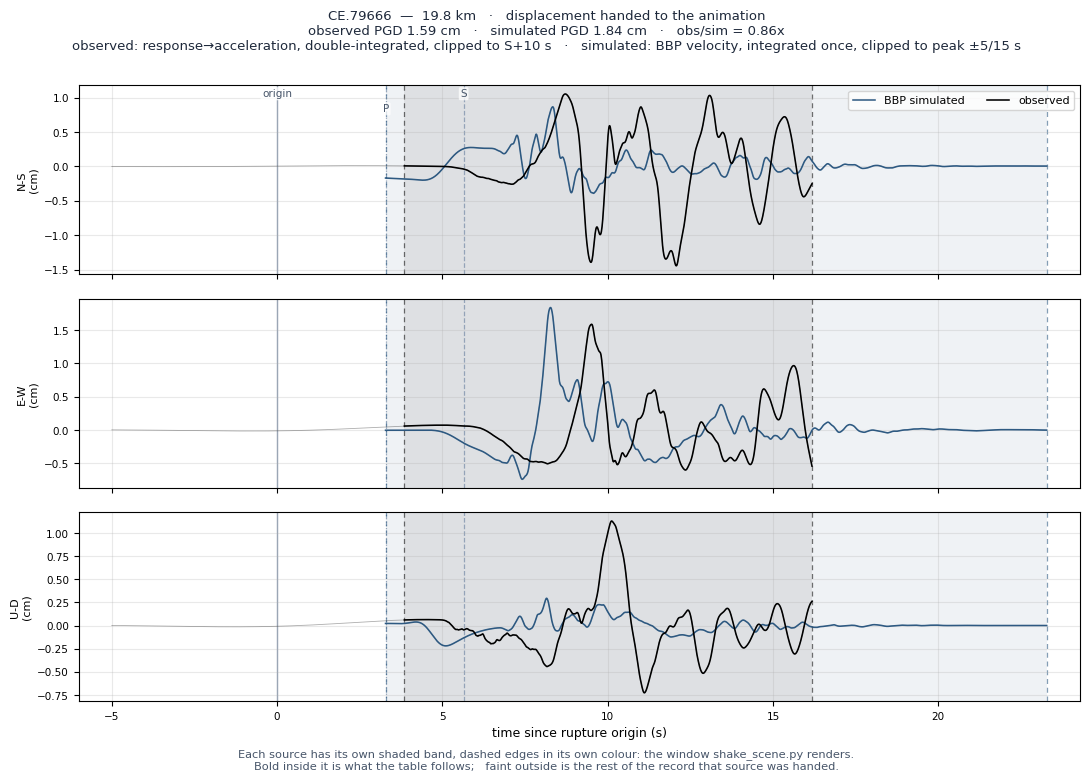
| CE.79666 | 19.8 | 348 | 348 | HNE | 0.1408 | 0.1381 | 0.0841 | 8.1 | 8.2 | 6.1 | 1.59 | 1.84 | 0.86x | +0.496 | — |
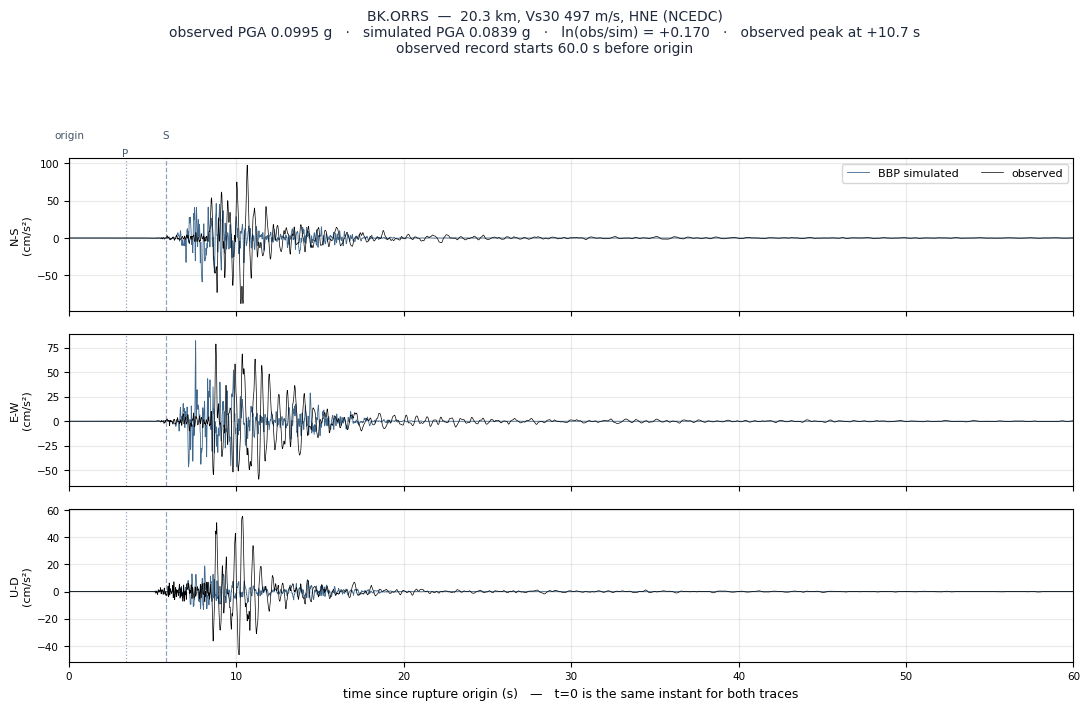
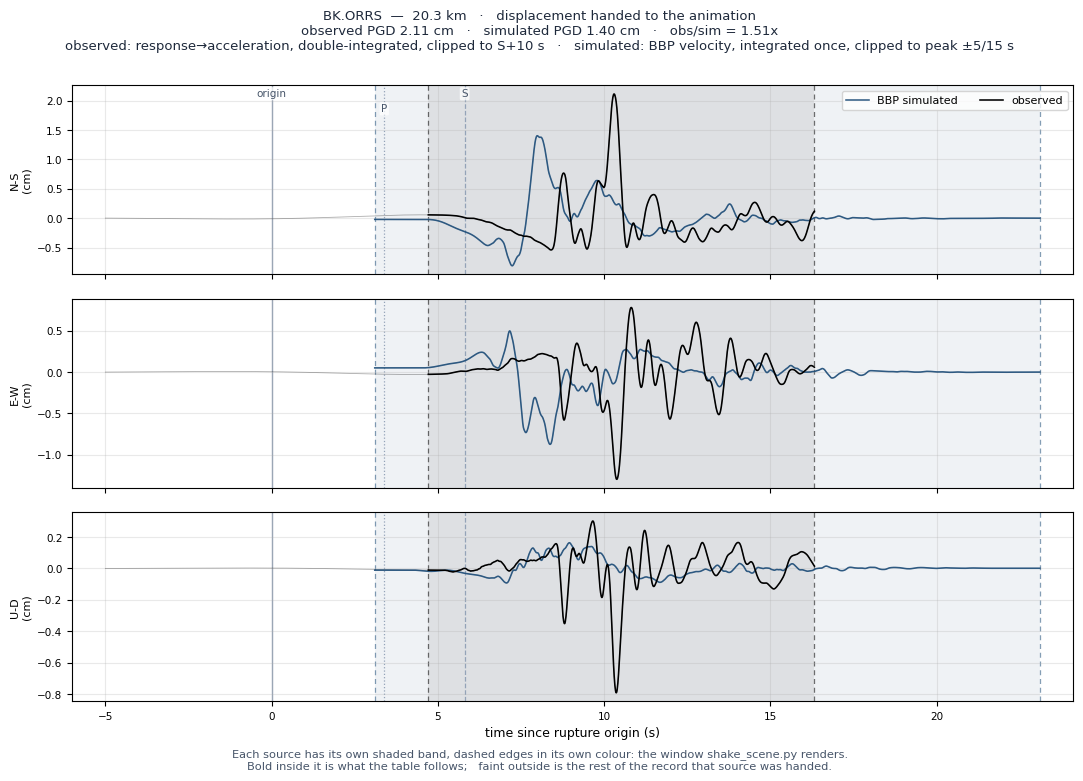
| BK.ORRS | 20.3 | 497 | 497 | HNE | 0.1008 | 0.0995 | 0.0839 | 11.1 | 10.7 | 5.9 | 2.11 | 1.40 | 1.51x | +0.170 | — |
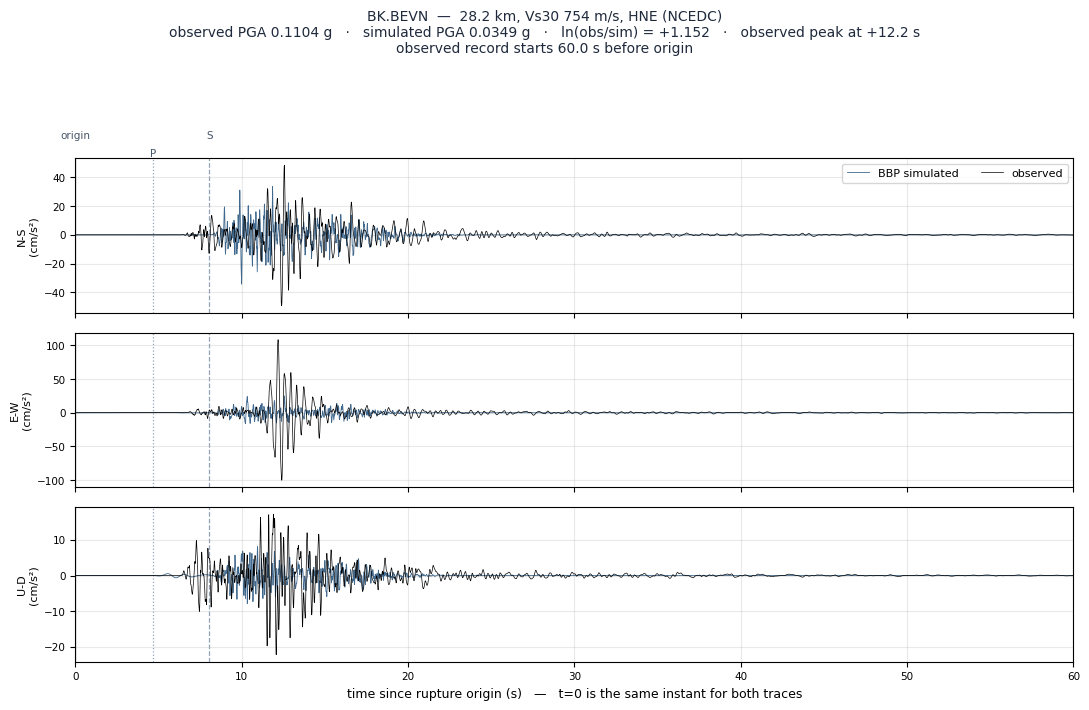
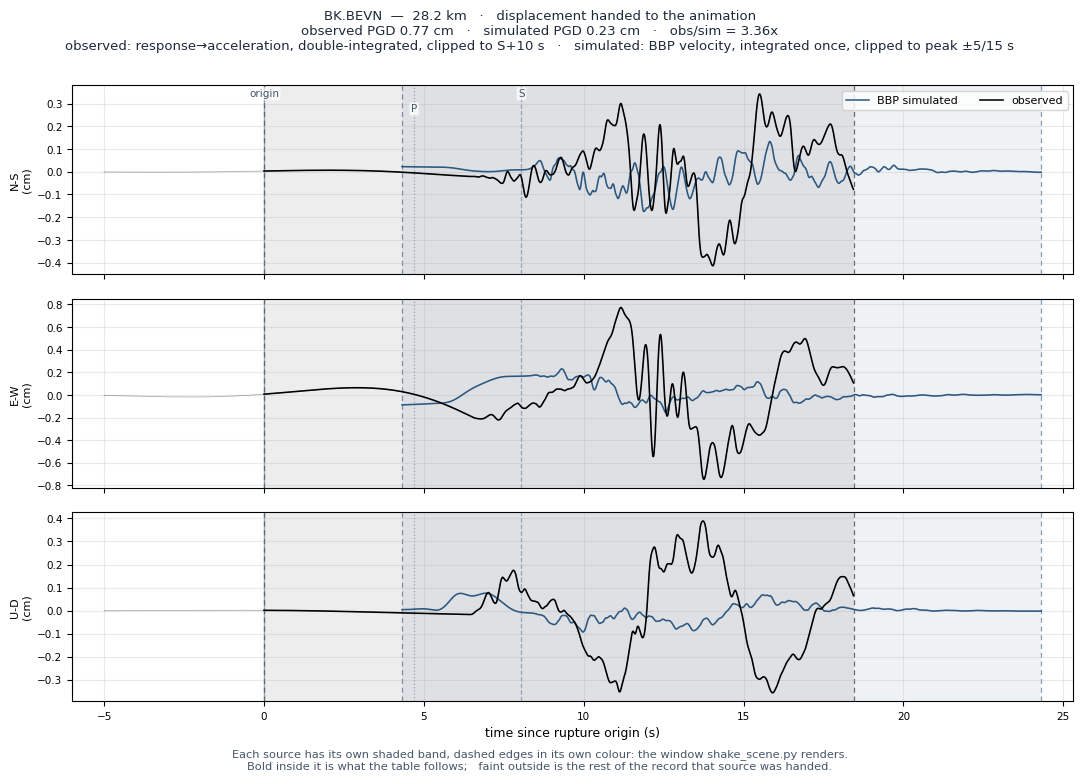
| BK.BEVN | 28.2 | 754 | 754 | HNE | 0.1108 | 0.1104 | 0.0349 | 7.6 | 7.5 | 1.4 | 0.77 | 0.23 | 3.36x | +1.152 | — |
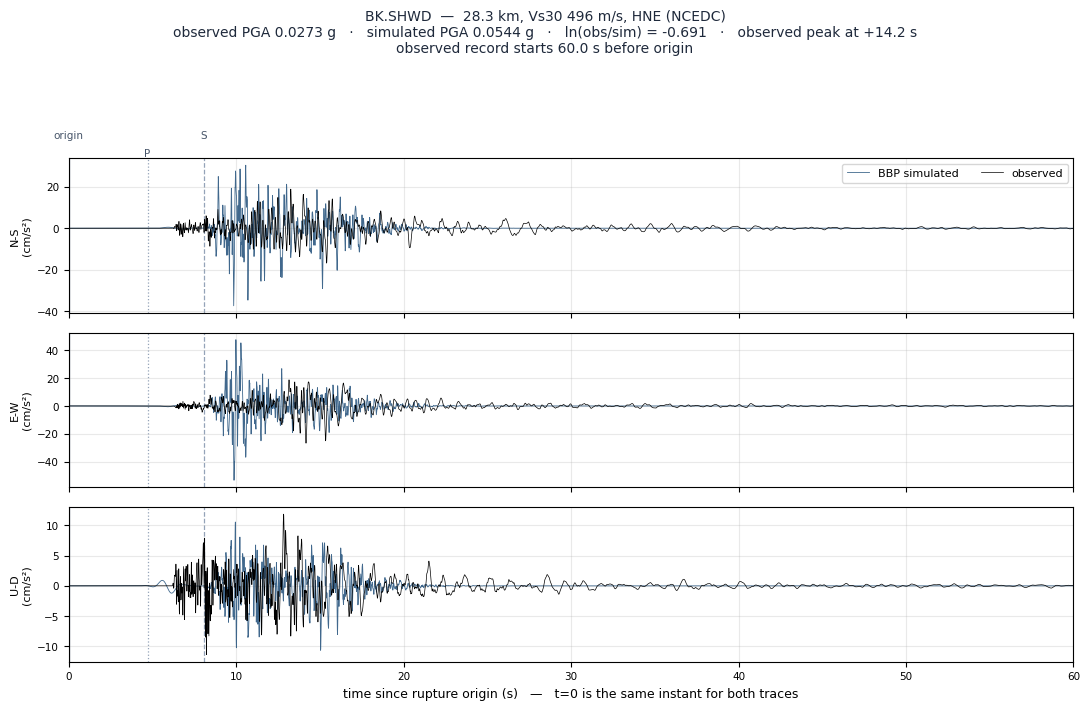
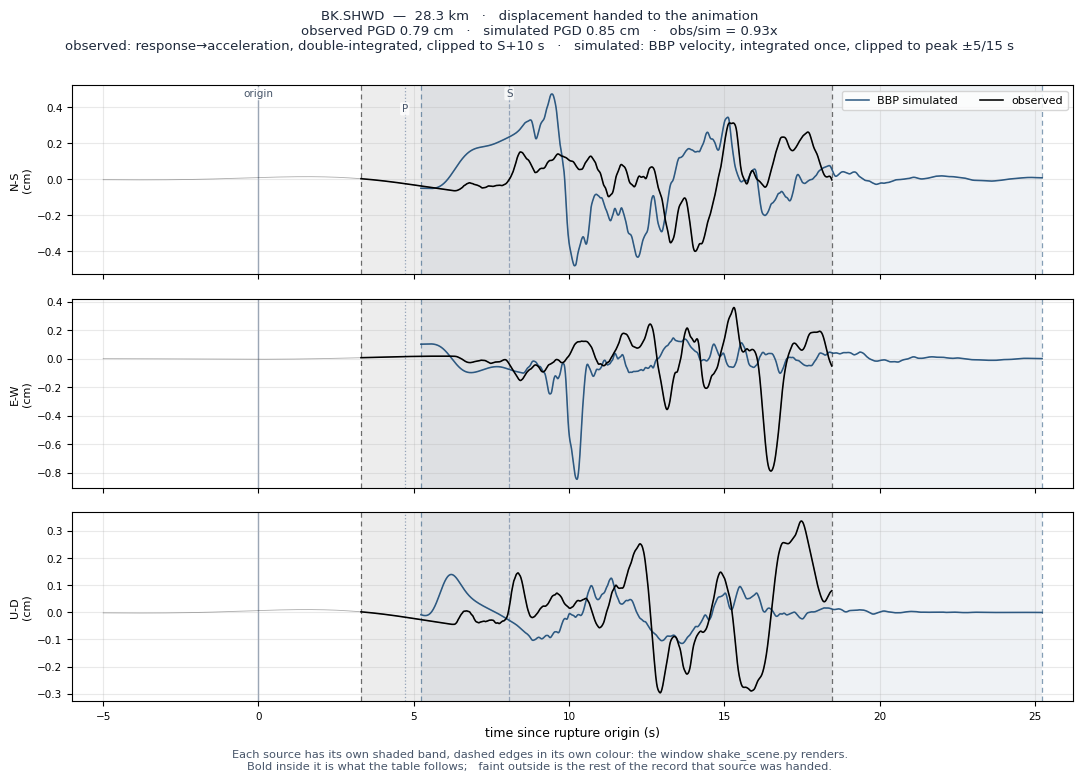
| BK.SHWD | 28.3 | 496 | 496 | HNE | 0.0273 | 0.0273 | 0.0544 | 2.6 | 2.7 | 4.4 | 0.79 | 0.85 | 0.93x | -0.691 | — |
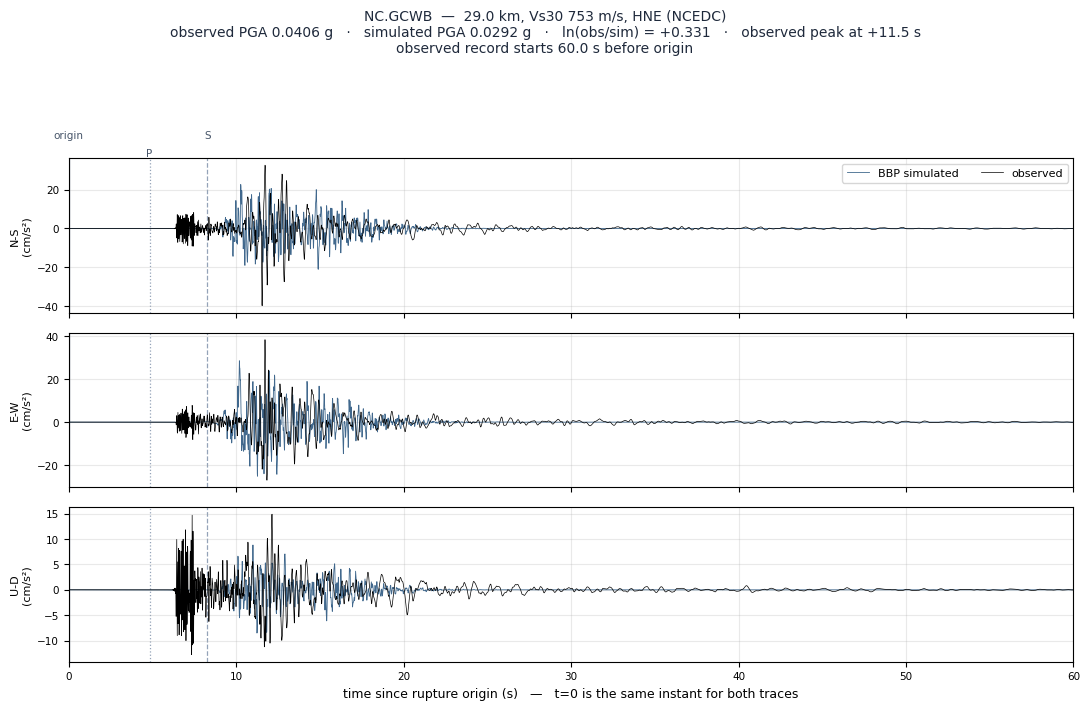
| NC.GCWB | 29.0 | 753 | 753 | HNE | 0.0426 | 0.0406 | 0.0292 | 2.6 | 2.7 | 2.8 | 0.56 | 0.47 | 1.20x | +0.331 | — |
| BK.HULL | 30.0 | 756 | 756 | HNE | 0.0208 | 0.0209 | 0.0272 | 2.4 | 2.5 | 1.8 | 0.48 | 0.38 | 1.26x | -0.262 | — |
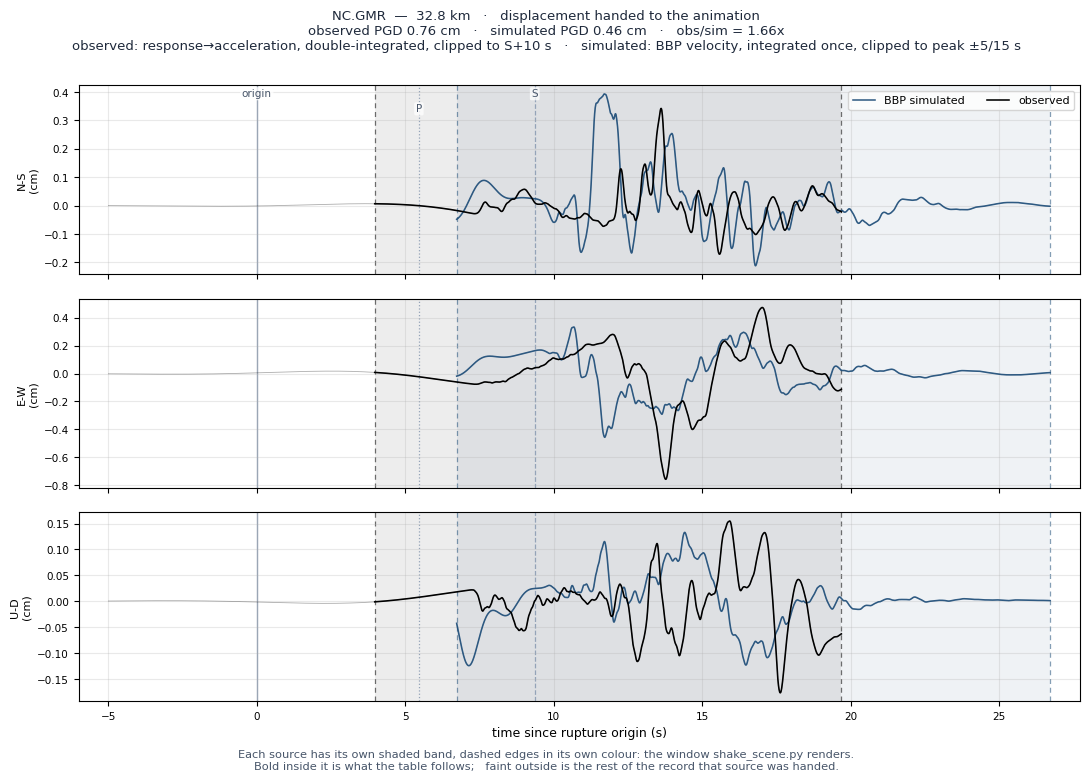
| NC.GMR | 32.8 | 496 | 496 | HNE | 0.0268 | 0.0268 | 0.0394 | 2.2 | 2.1 | 2.5 | 0.76 | 0.46 | 1.66x | -0.386 | — |
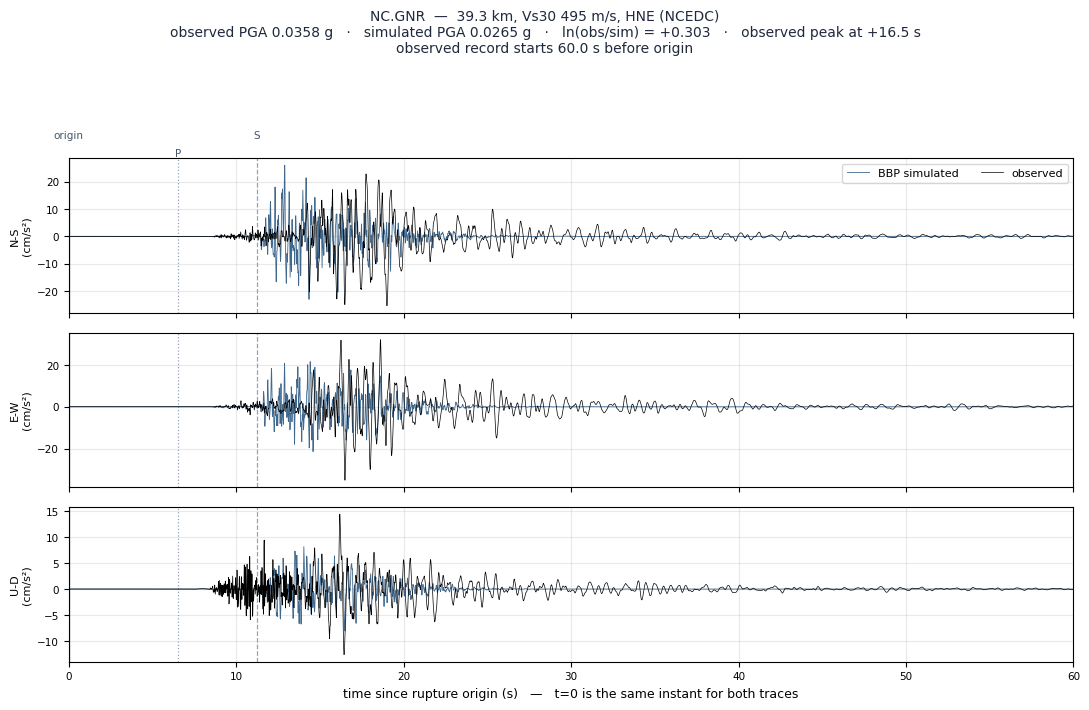
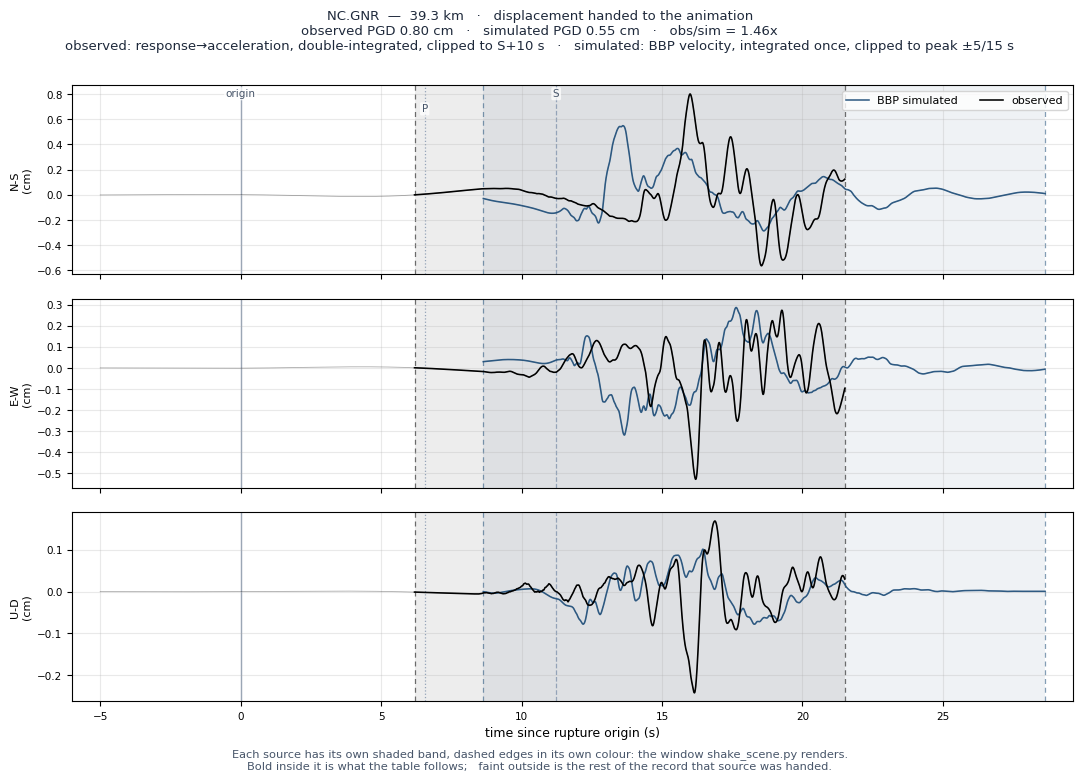
| NC.GNR | 39.3 | 495 | 495 | HNE | 0.0363 | 0.0358 | 0.0265 | 3.2 | 3.1 | 2.3 | 0.80 | 0.55 | 1.46x | +0.303 | — |
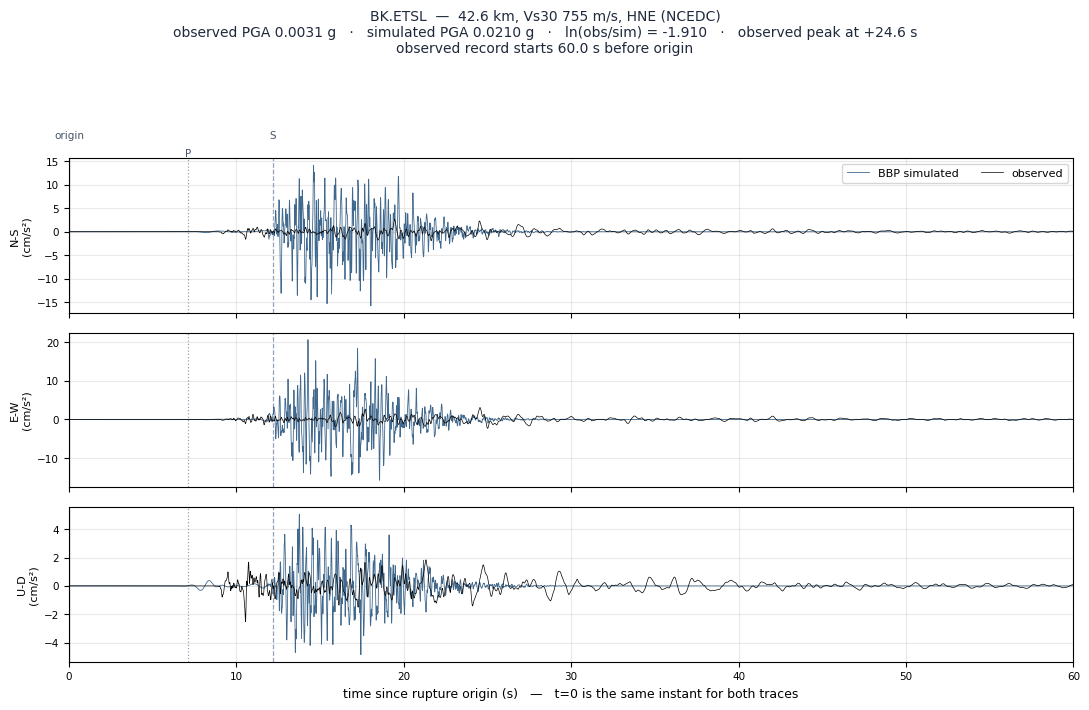
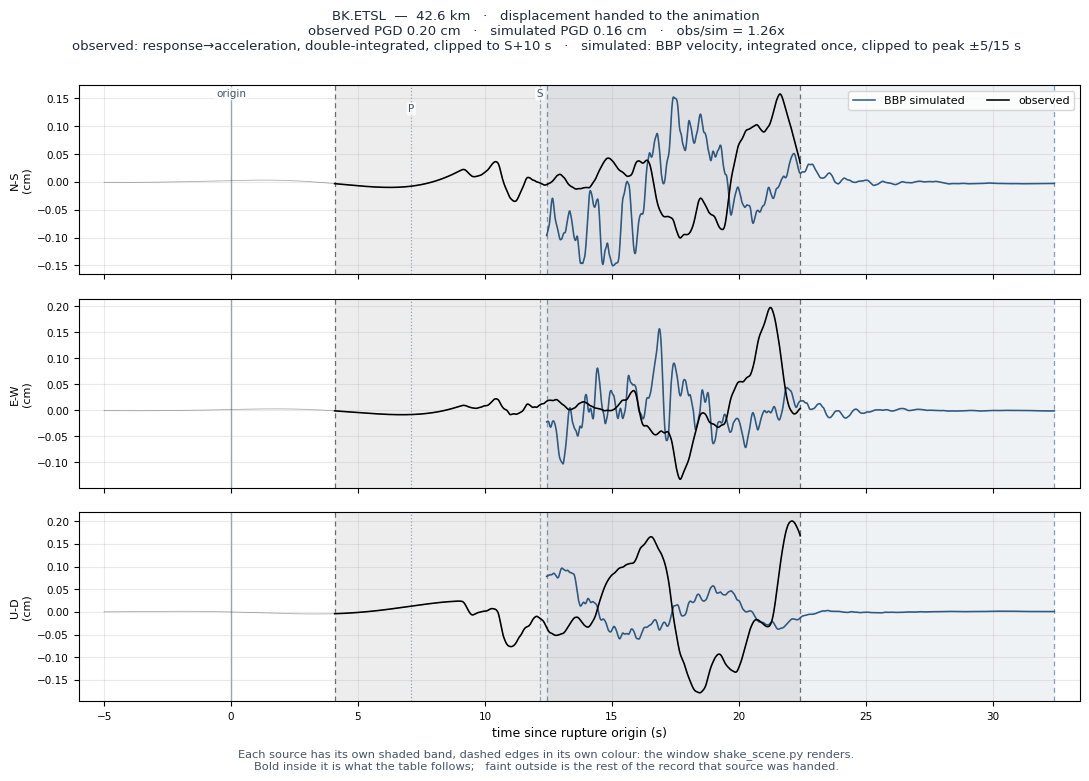
| BK.ETSL | 42.6 | 755 | 755 | HNE | 0.0031 | 0.0031 | 0.0210 | 0.6 | 0.6 | 1.4 | 0.20 | 0.16 | 1.26x | -1.910 | Outl |
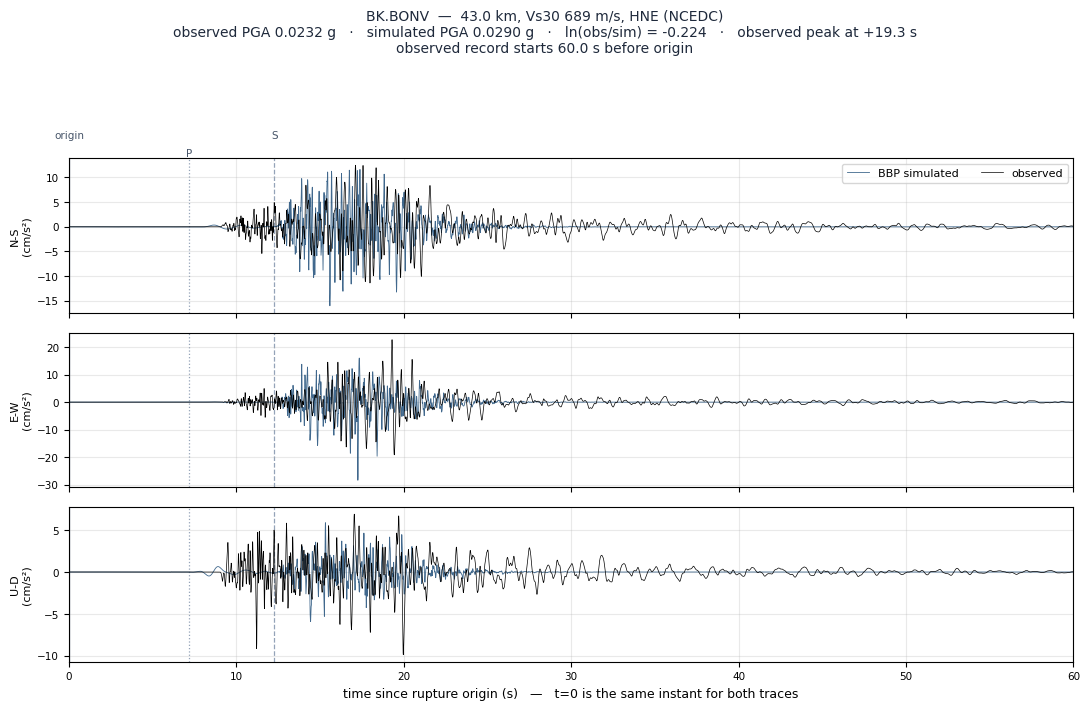
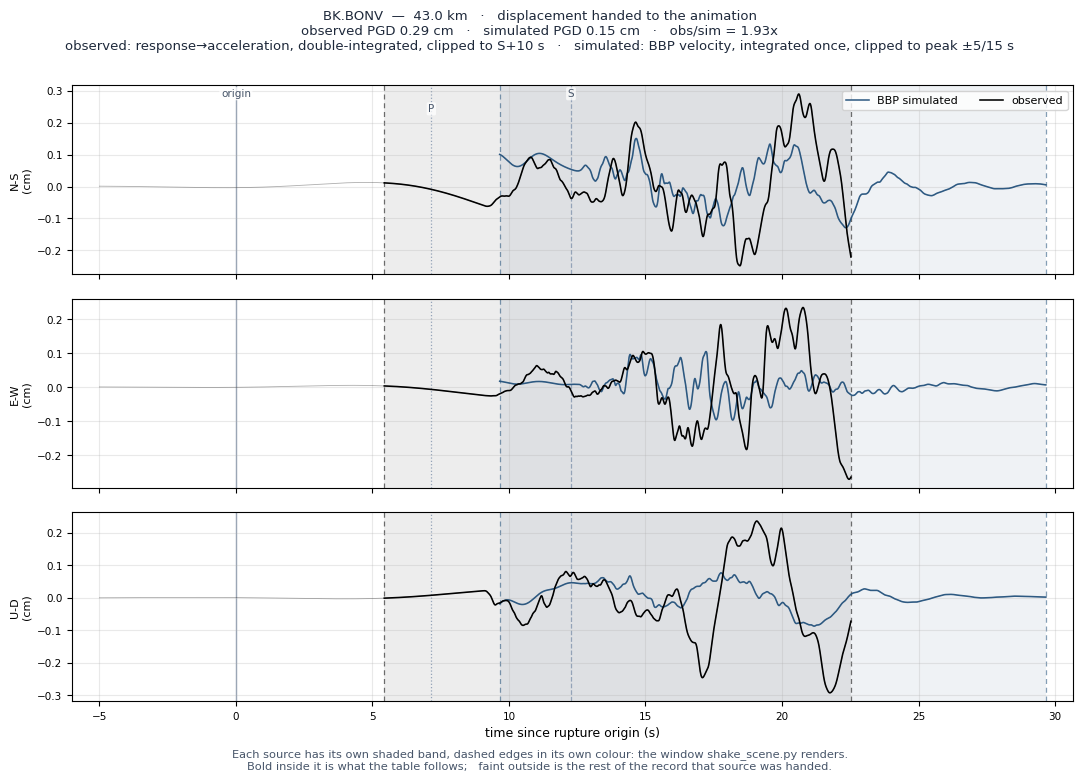
| BK.BONV | 43.0 | 689 | 689 | HNE | 0.0234 | 0.0232 | 0.0290 | 1.6 | 1.7 | 1.5 | 0.29 | 0.15 | 1.93x | -0.224 | — |
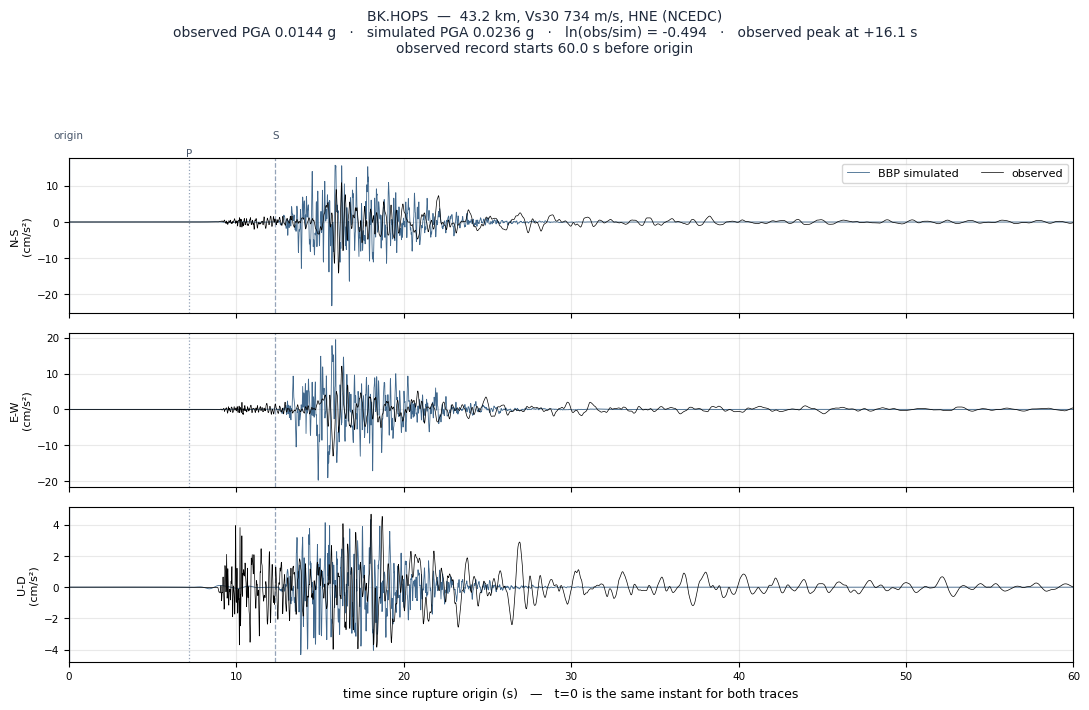
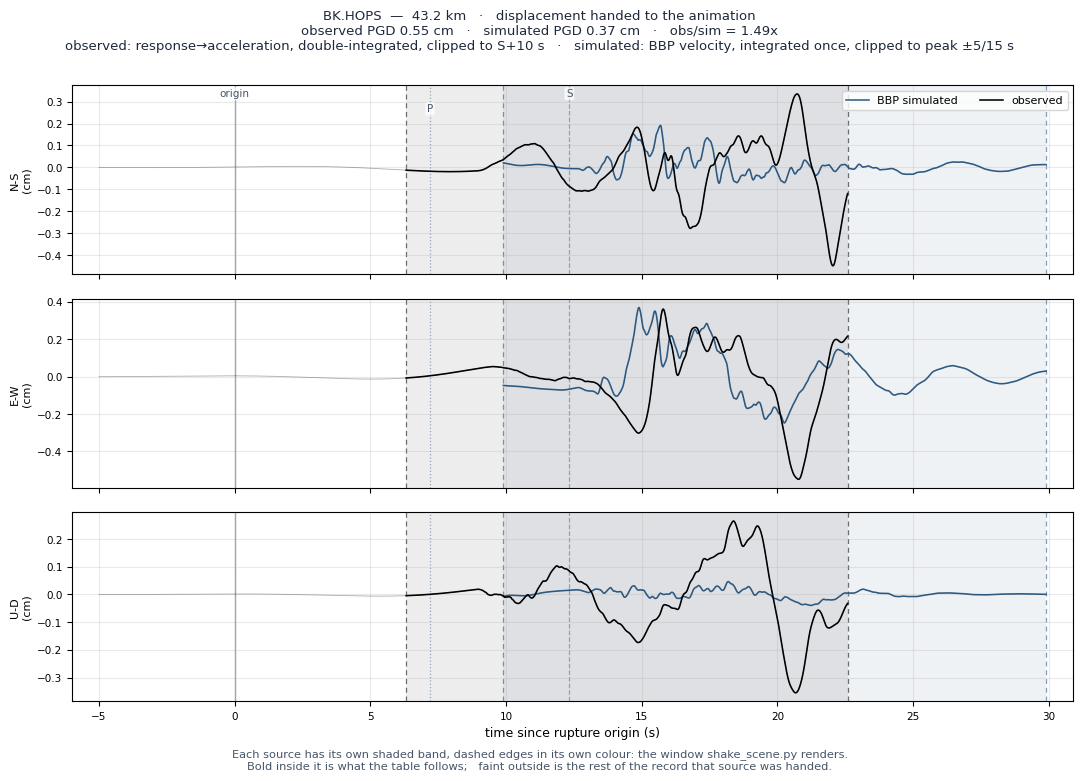
| BK.HOPS | 43.2 | 734 | 734 | HNE | 0.0147 | 0.0144 | 0.0236 | 1.3 | 1.3 | 1.7 | 0.55 | 0.37 | 1.49x | -0.494 | — |
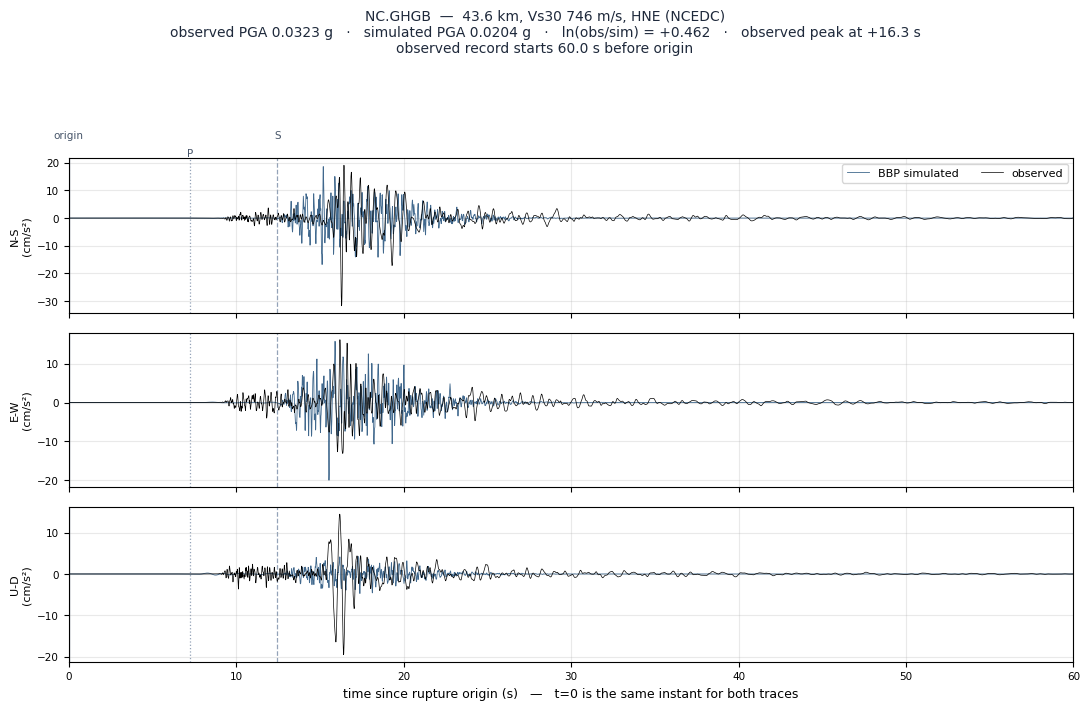
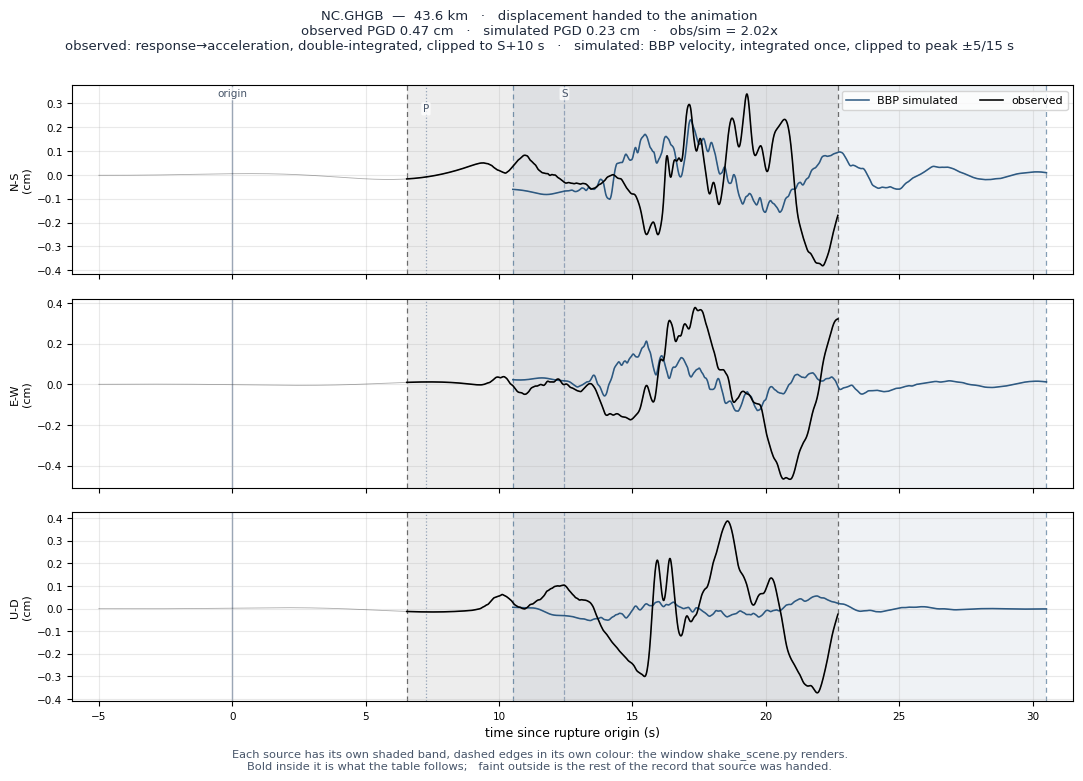
| NC.GHGB | 43.6 | 746 | 746 | HNE | 0.0328 | 0.0323 | 0.0204 | 2.0 | 2.0 | 1.1 | 0.47 | 0.23 | 2.02x | +0.462 | — |
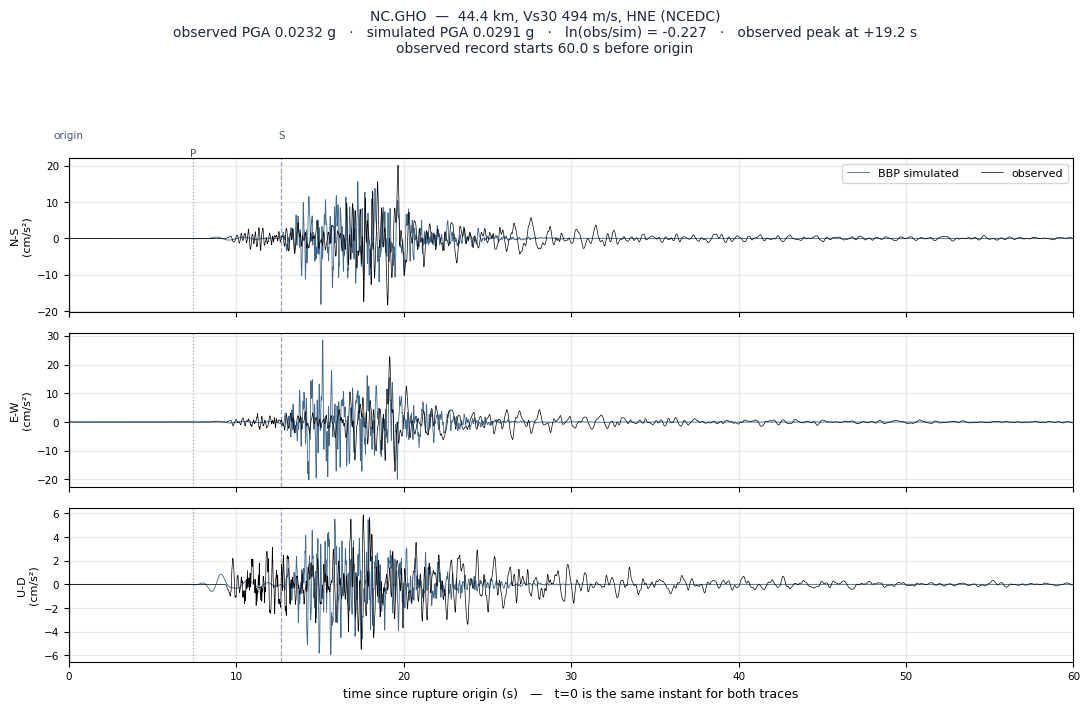
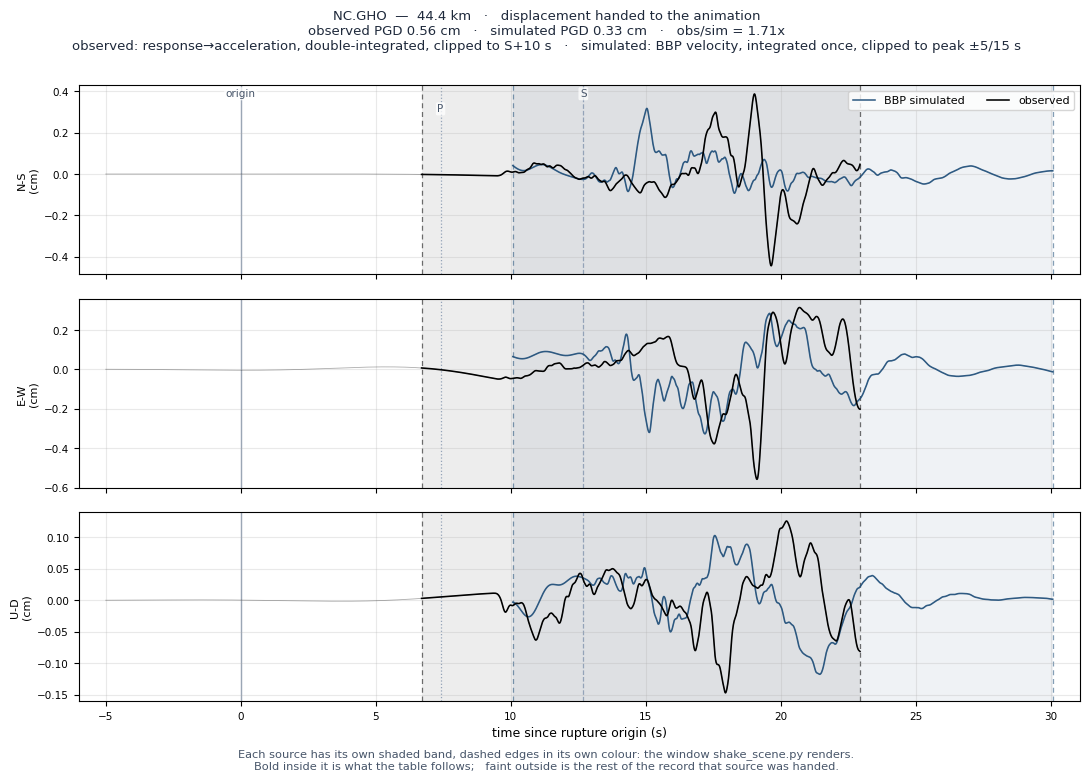
| NC.GHO | 44.4 | 494 | 494 | HNE | 0.0232 | 0.0232 | 0.0291 | 2.7 | 2.7 | 1.5 | 0.56 | 0.33 | 1.71x | -0.227 | — |
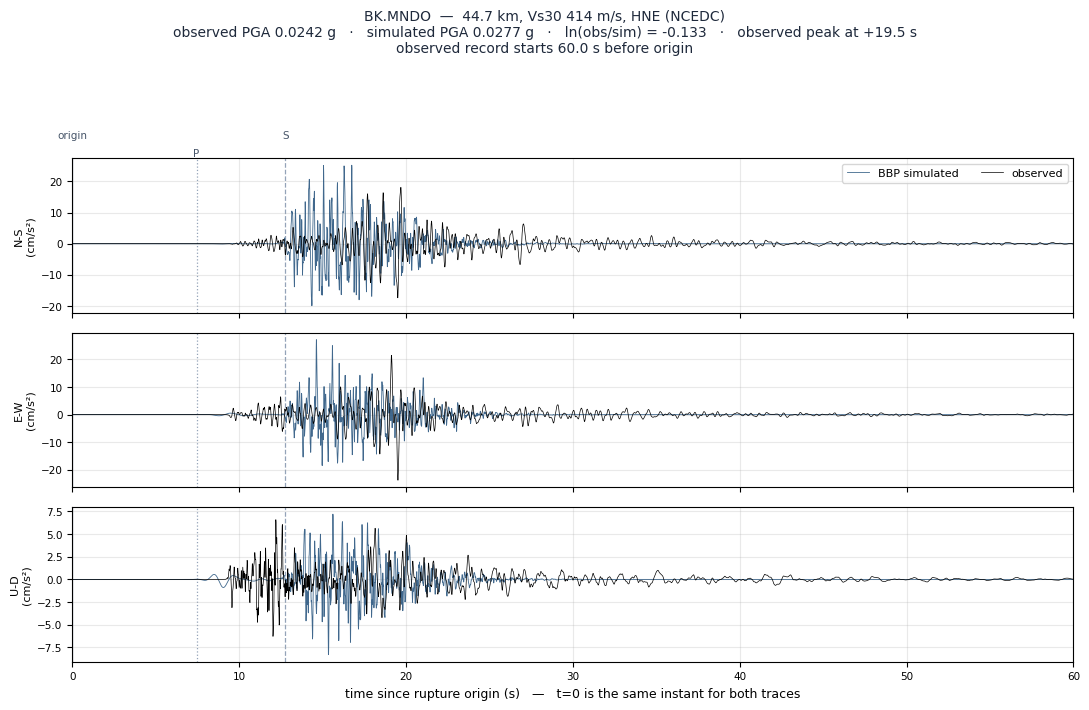
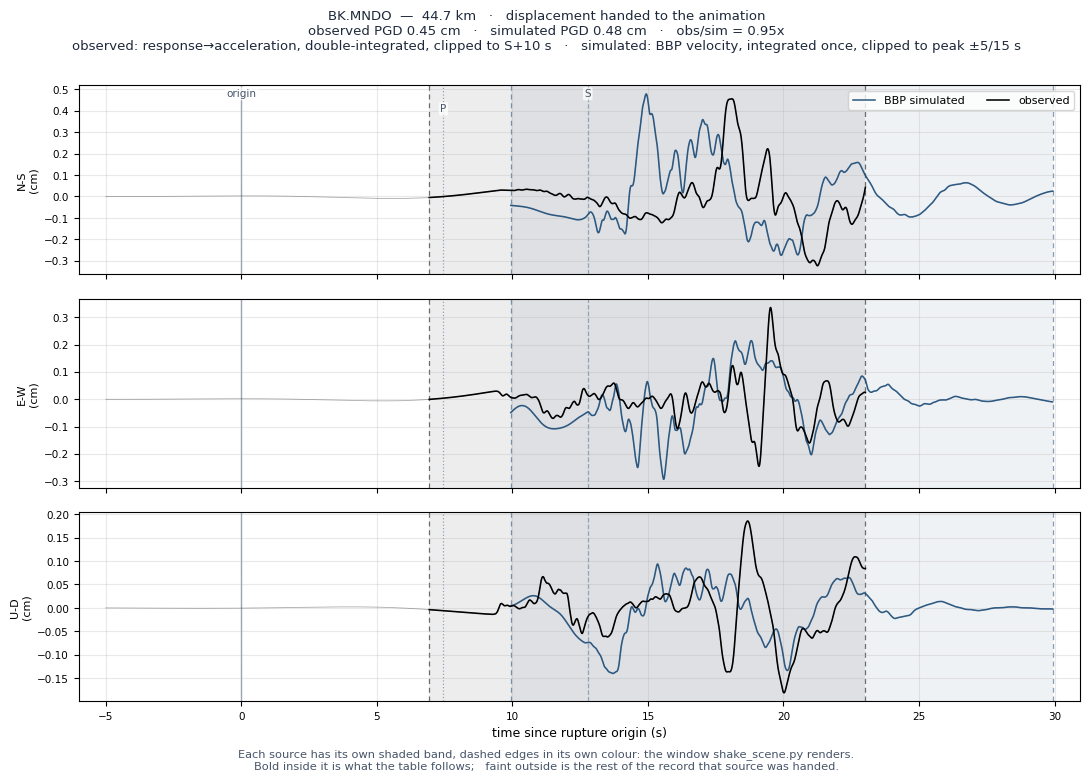
| BK.MNDO | 44.7 | 414 | 414 | HNE | 0.0245 | 0.0242 | 0.0277 | 1.9 | 1.9 | 1.6 | 0.45 | 0.48 | 0.95x | -0.133 | — |
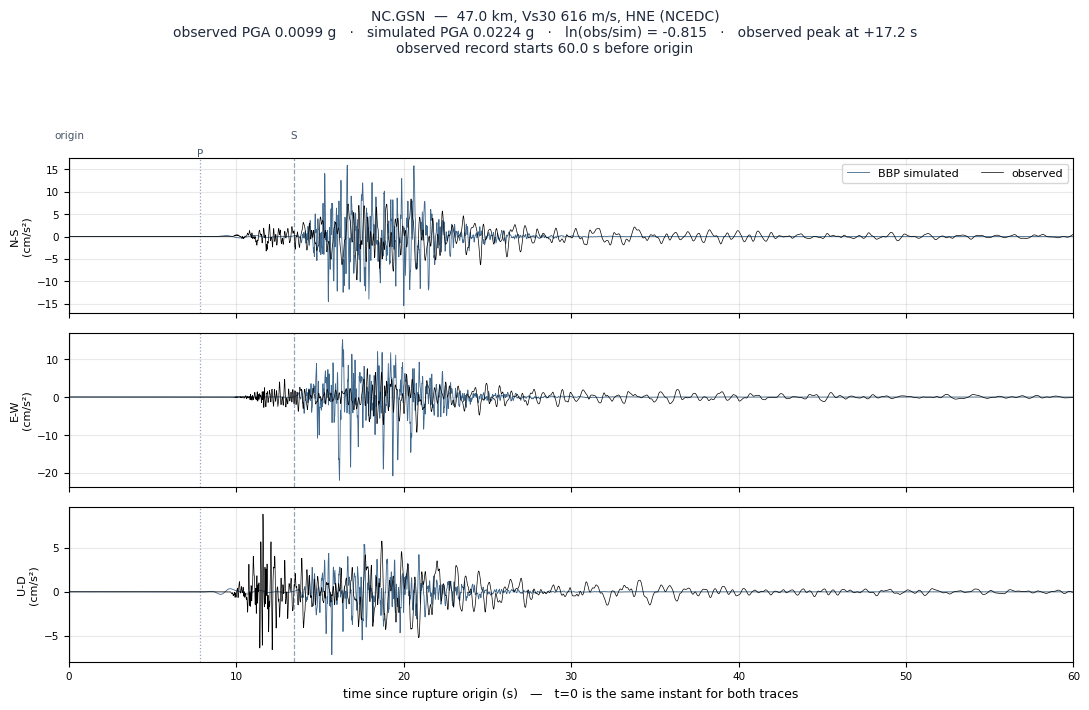
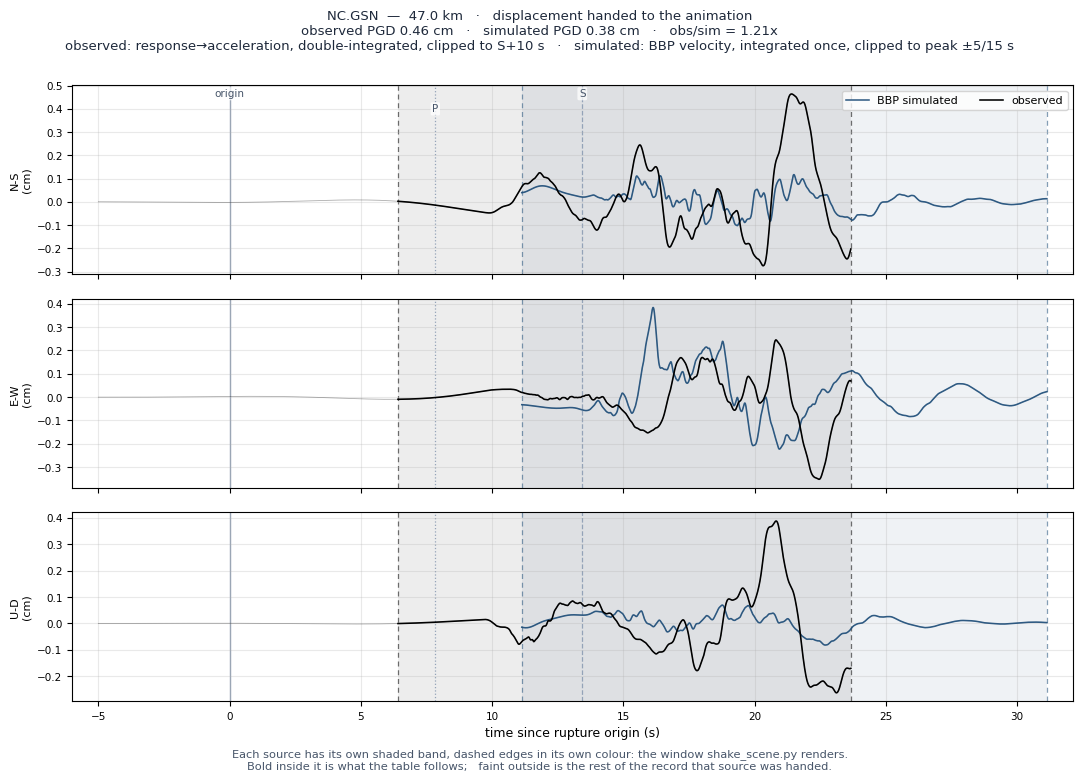
| NC.GSN | 47.0 | 616 | 616 | HNE | 0.0100 | 0.0099 | 0.0224 | 1.5 | 1.5 | 1.5 | 0.46 | 0.38 | 1.21x | -0.815 | — |
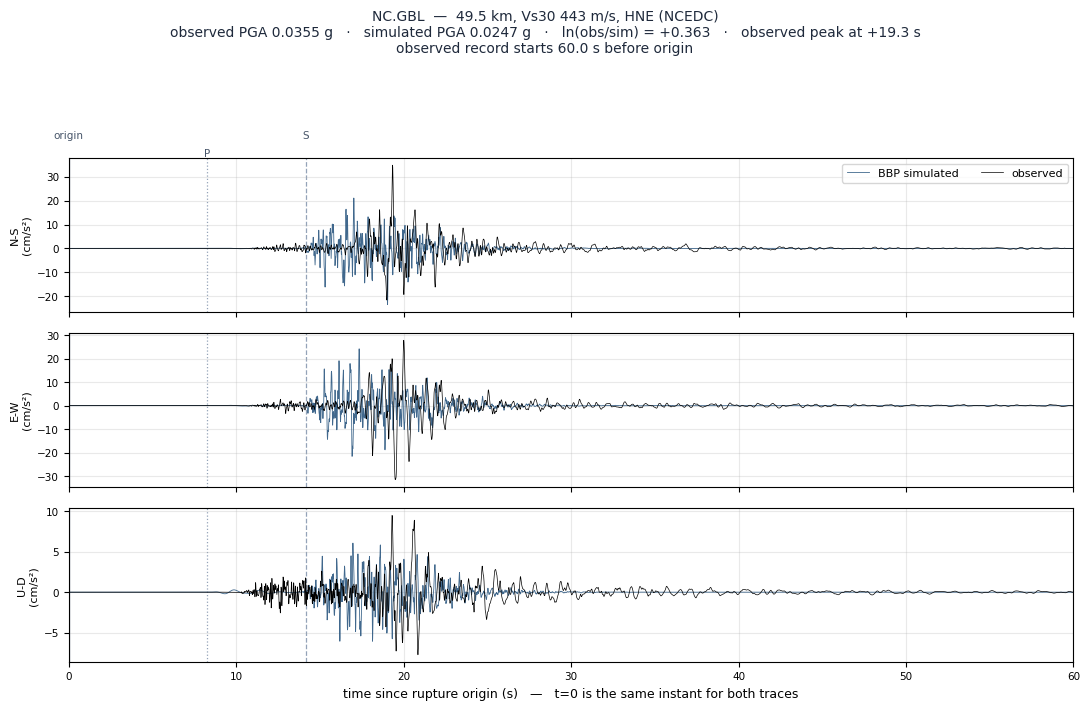
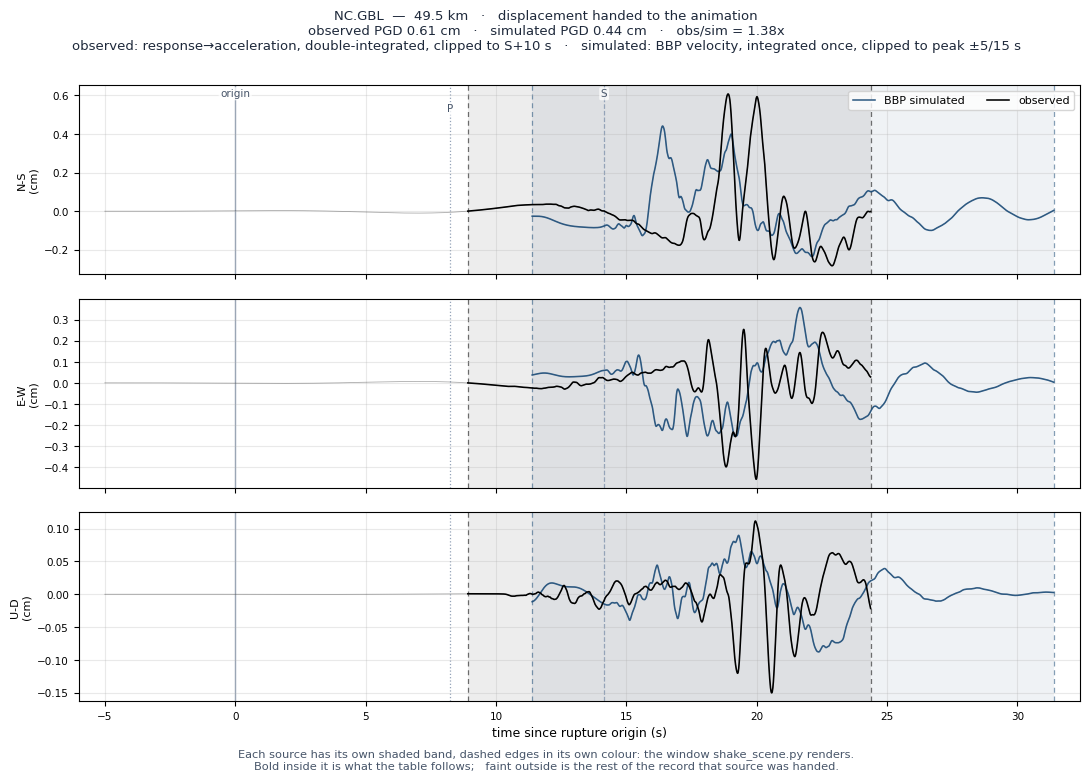
| NC.GBL | 49.5 | 443 | 443 | HNE | 0.0356 | 0.0355 | 0.0247 | 2.9 | 2.8 | 1.7 | 0.61 | 0.44 | 1.38x | +0.363 | — |
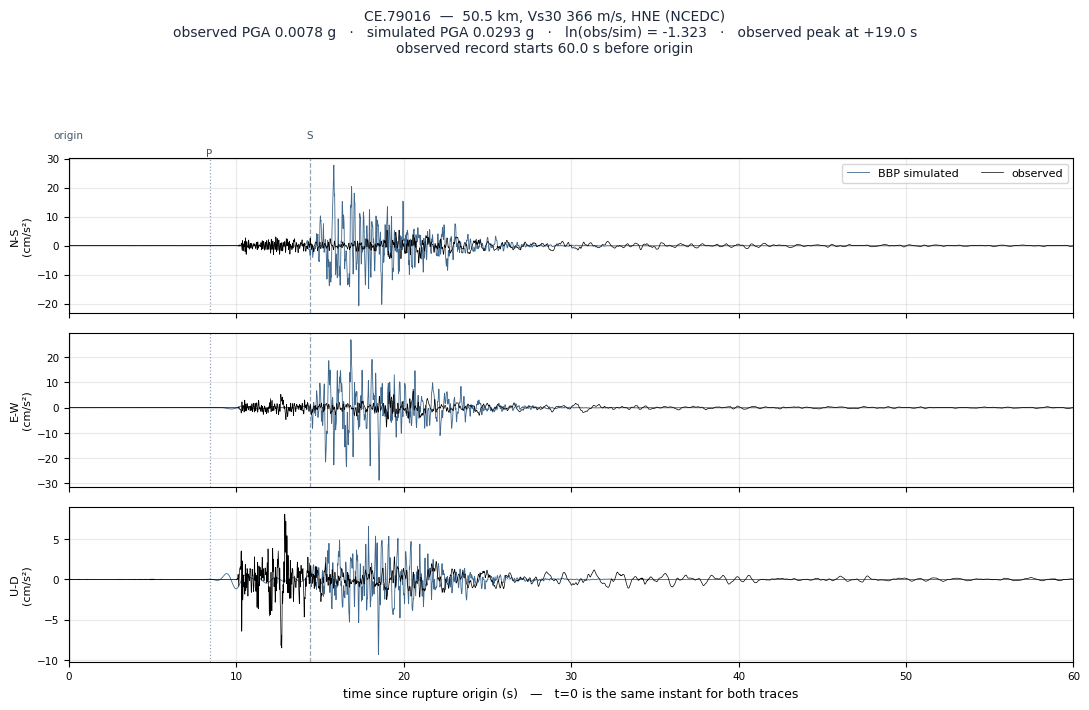
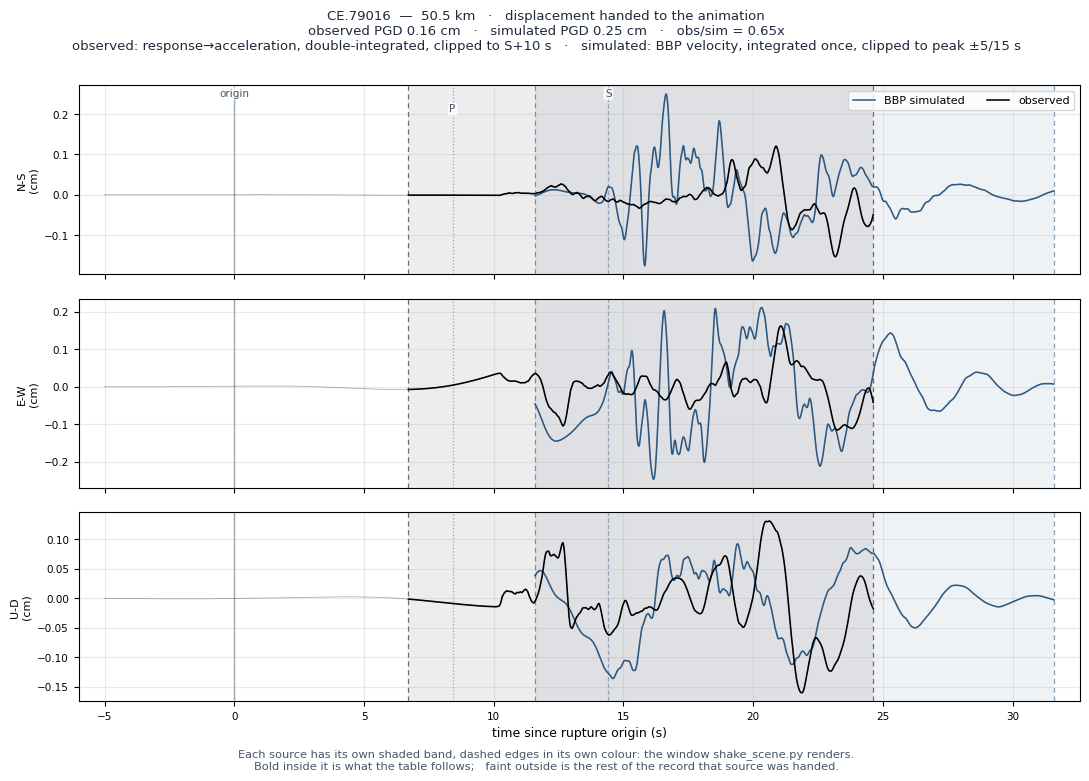
| CE.79016 | 50.5 | 366 | 366 | HNE | 0.0081 | 0.0078 | 0.0293 | 0.6 | 0.5 | 2.1 | 0.16 | 0.25 | 0.65x | -1.323 | — |
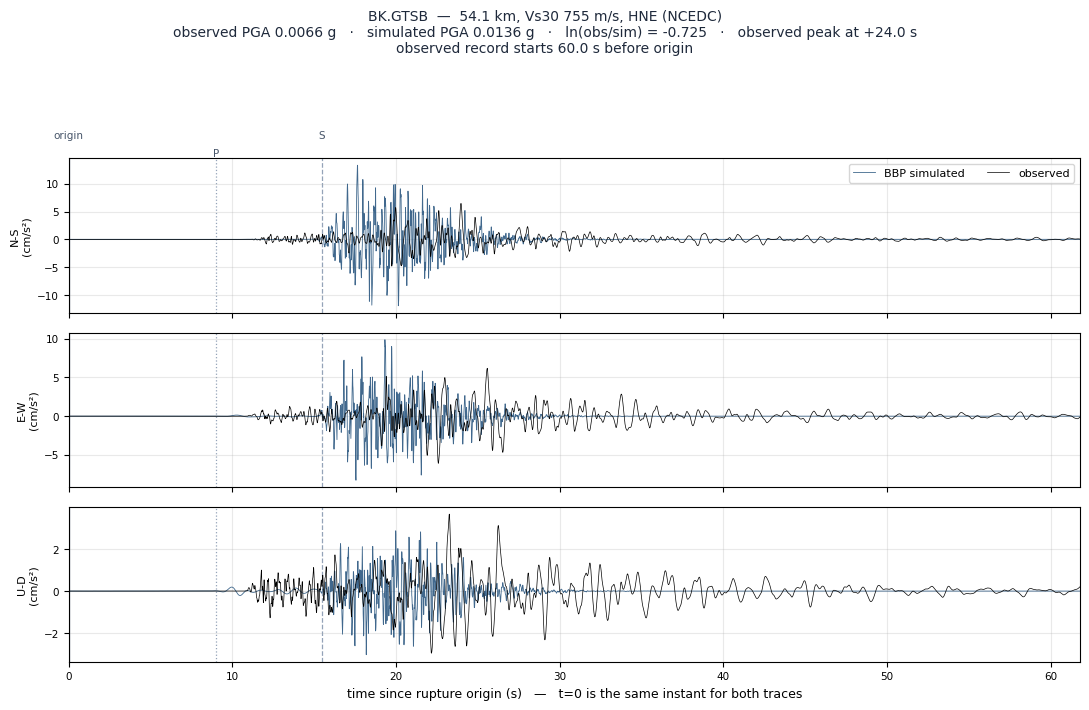
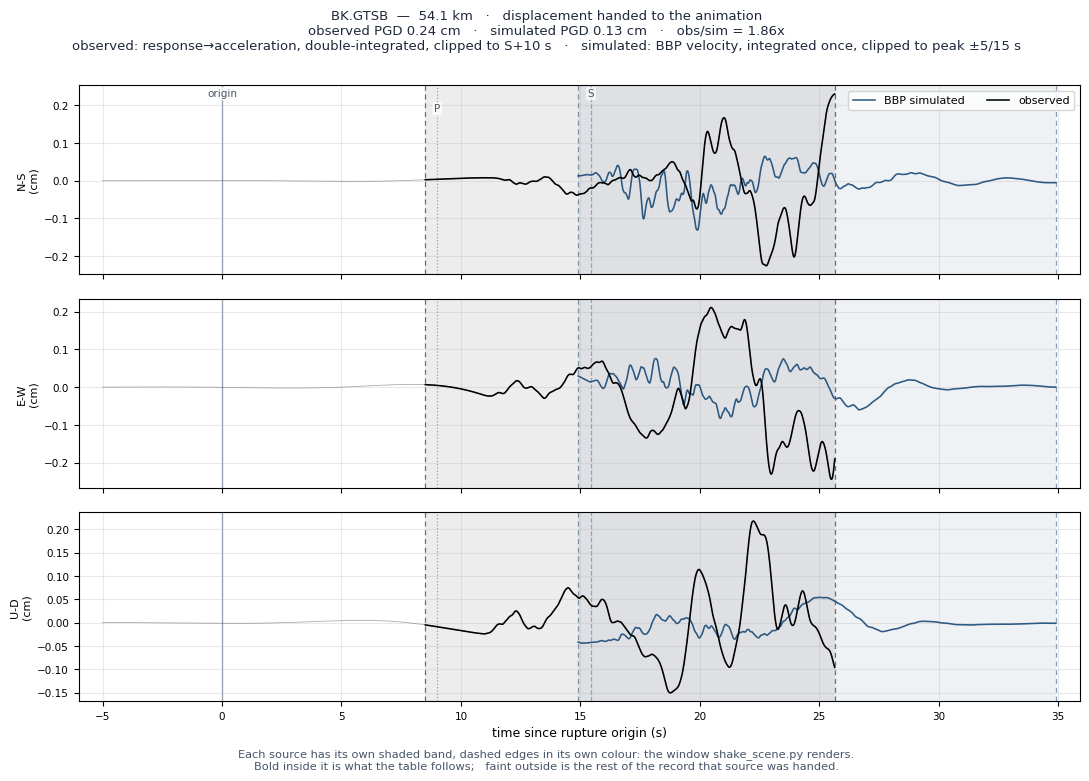
| BK.GTSB | 54.1 | 755 | 755 | HNE | 0.0066 | 0.0066 | 0.0136 | 1.0 | 1.0 | 0.9 | 0.24 | 0.13 | 1.86x | -0.725 | — |
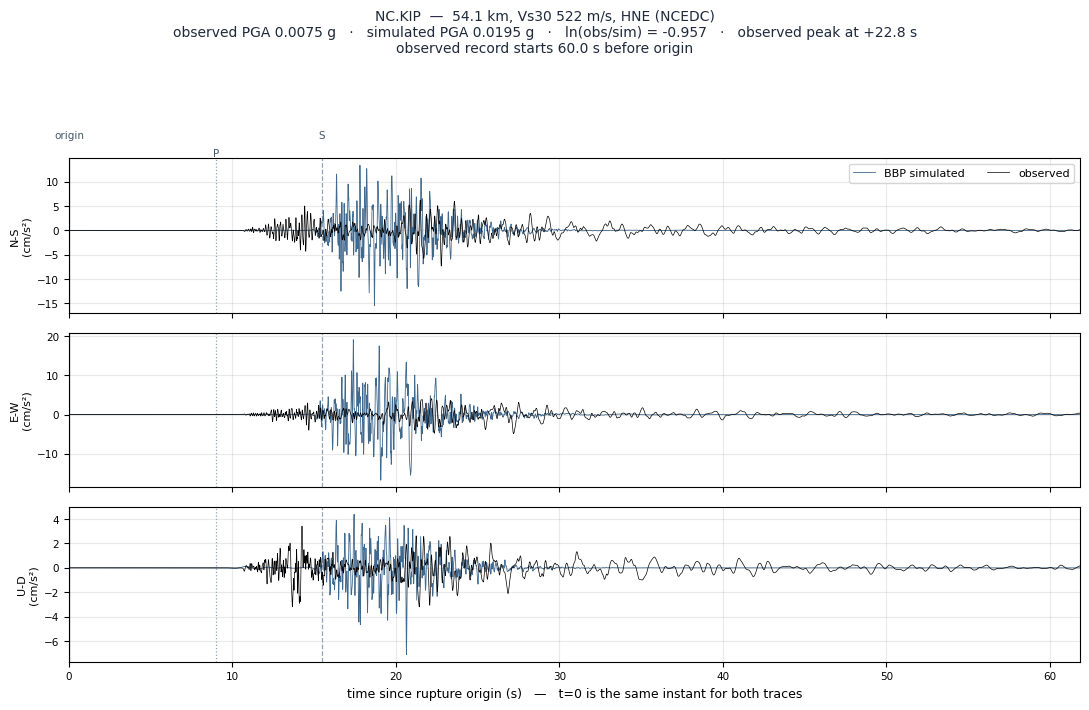
| NC.KIP | 54.1 | 522 | 522 | HNE | 0.0077 | 0.0075 | 0.0195 | 0.8 | 0.8 | 1.7 | 0.20 | 0.32 | 0.63x | -0.957 | — |
| NC.GSR | 54.9 | 750 | 750 | HNE | 0.0176 | 0.0175 | 0.0155 | 1.7 | 1.7 | 0.9 | 0.37 | 0.12 | 3.04x | +0.124 | — |
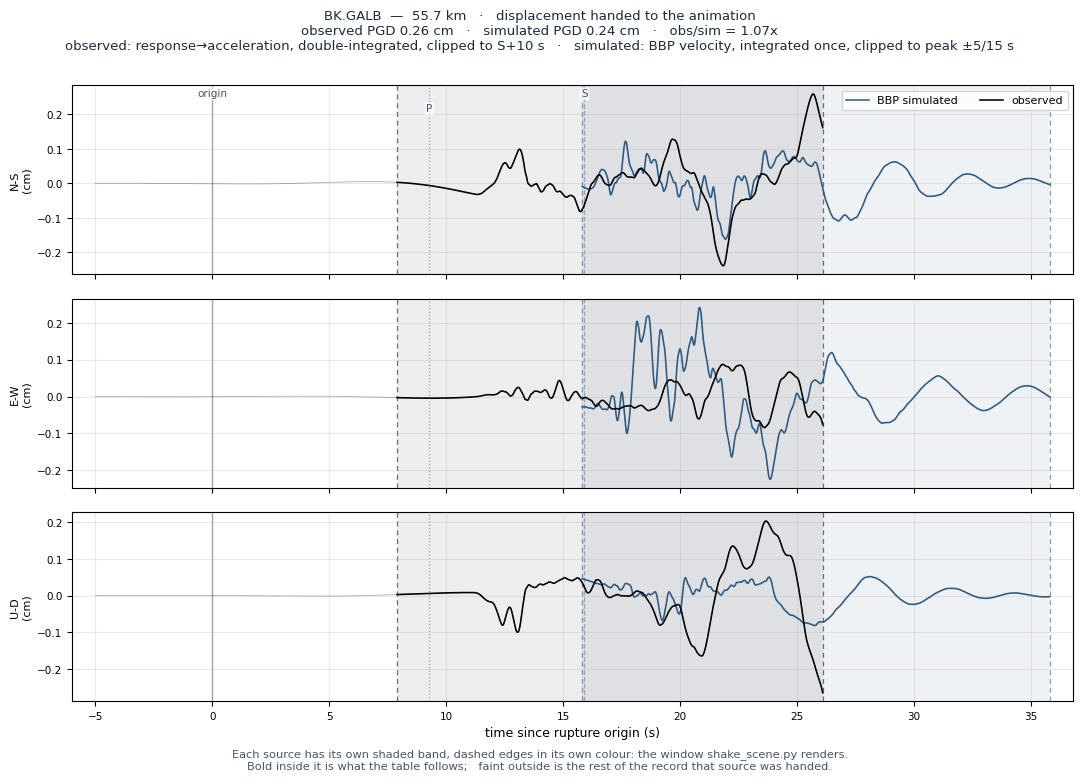
| BK.GALB | 55.7 | 486 | 486 | HNE | 0.0064 | 0.0061 | 0.0177 | 0.6 | 0.6 | 1.2 | 0.26 | 0.24 | 1.07x | -1.059 | — |
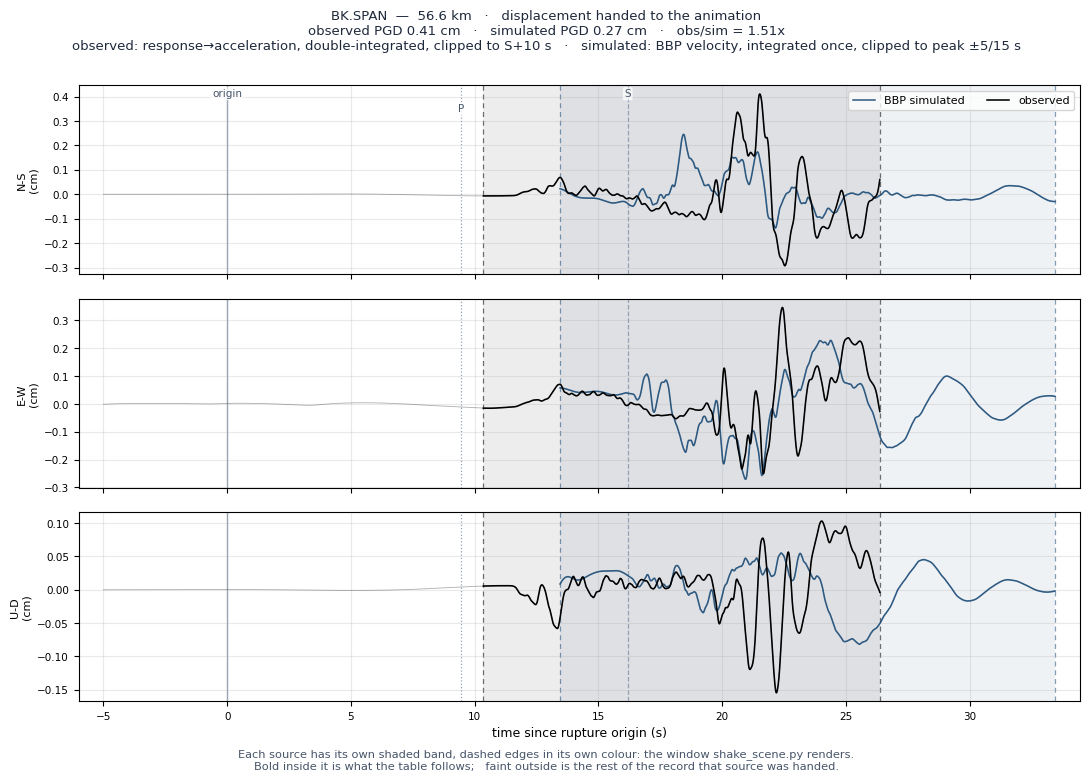
| BK.SPAN | 56.6 | 494 | 494 | HNE | 0.0274 | 0.0271 | 0.0180 | 2.2 | 2.1 | 1.3 | 0.41 | 0.27 | 1.51x | +0.406 | — |
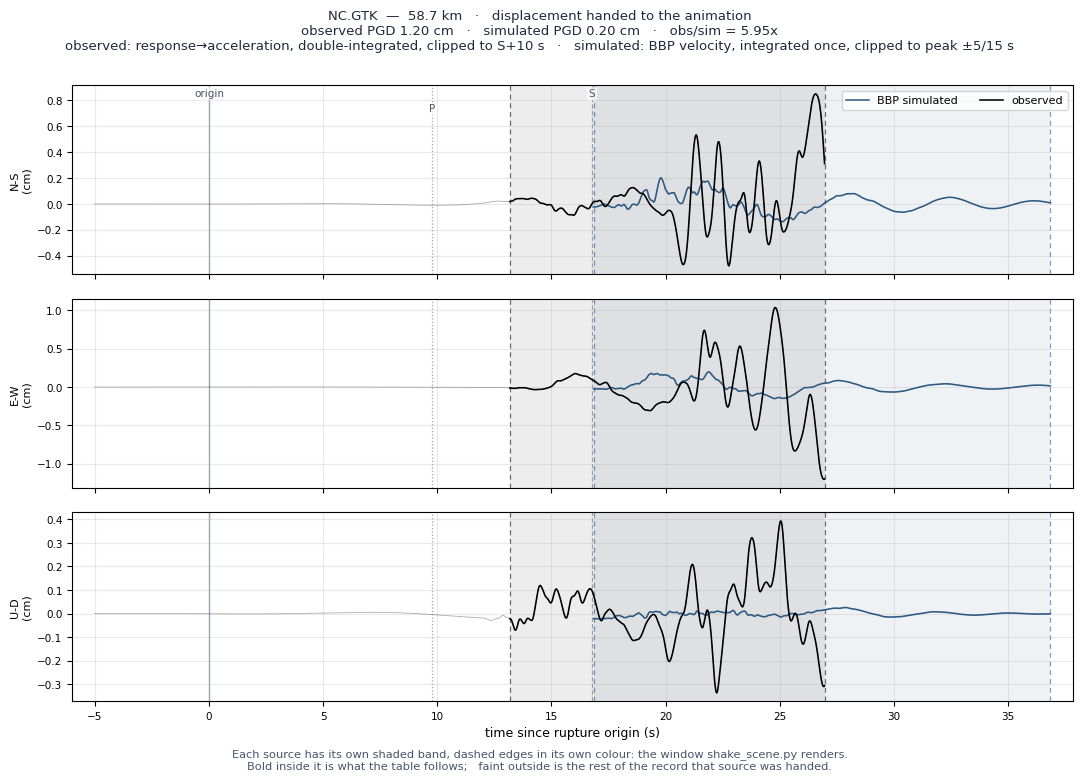
| NC.GTK | 58.7 | 708 | 708 | HNE | 0.0305 | 0.0304 | 0.0134 | 3.8 | 3.8 | 0.9 | 1.20 | 0.20 | 5.95x | +0.821 | Outl |
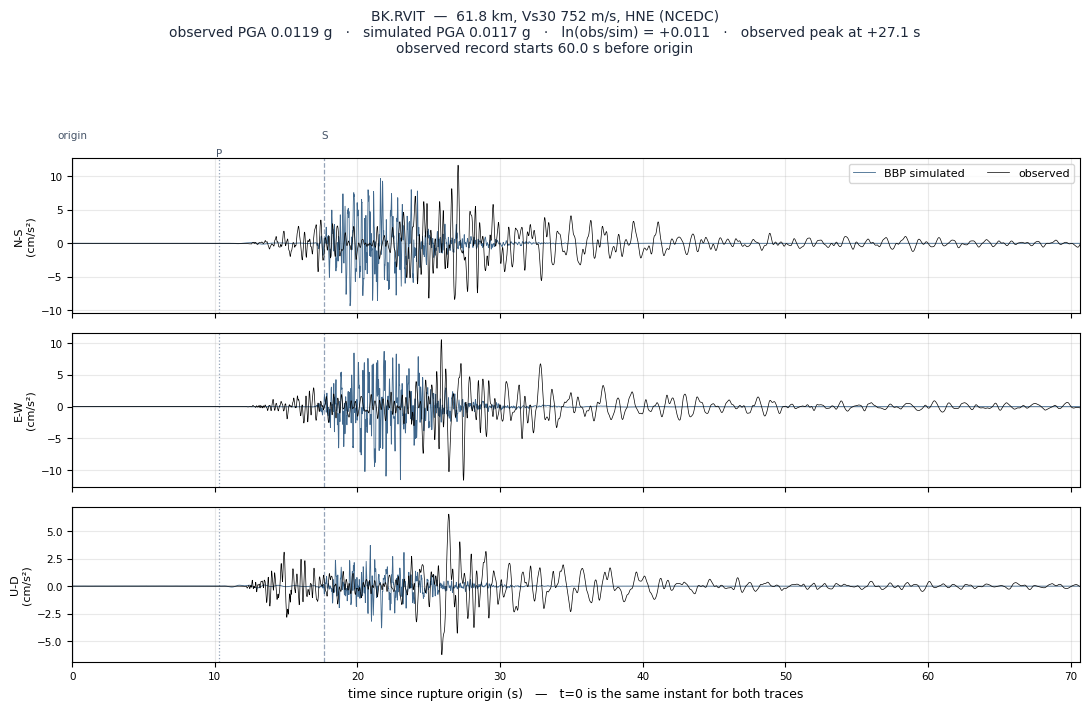
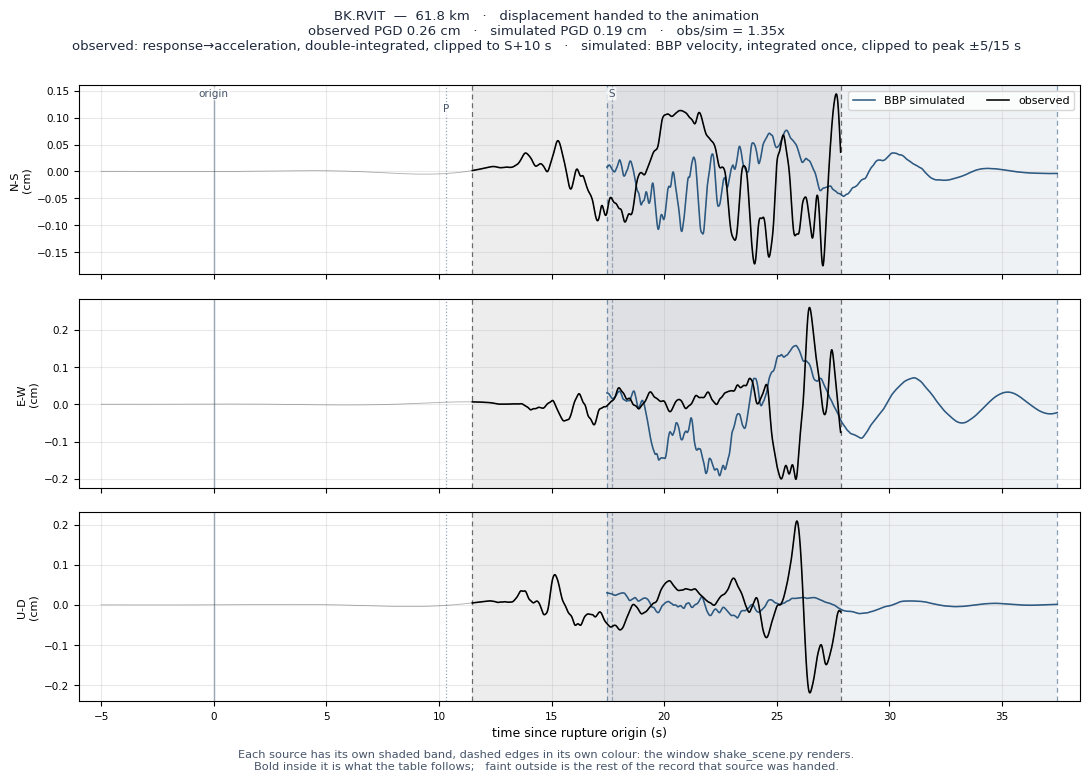
| BK.RVIT | 61.8 | 752 | 752 | HNE | 0.0120 | 0.0119 | 0.0117 | 1.2 | 1.3 | 0.7 | 0.26 | 0.19 | 1.35x | +0.011 | — |
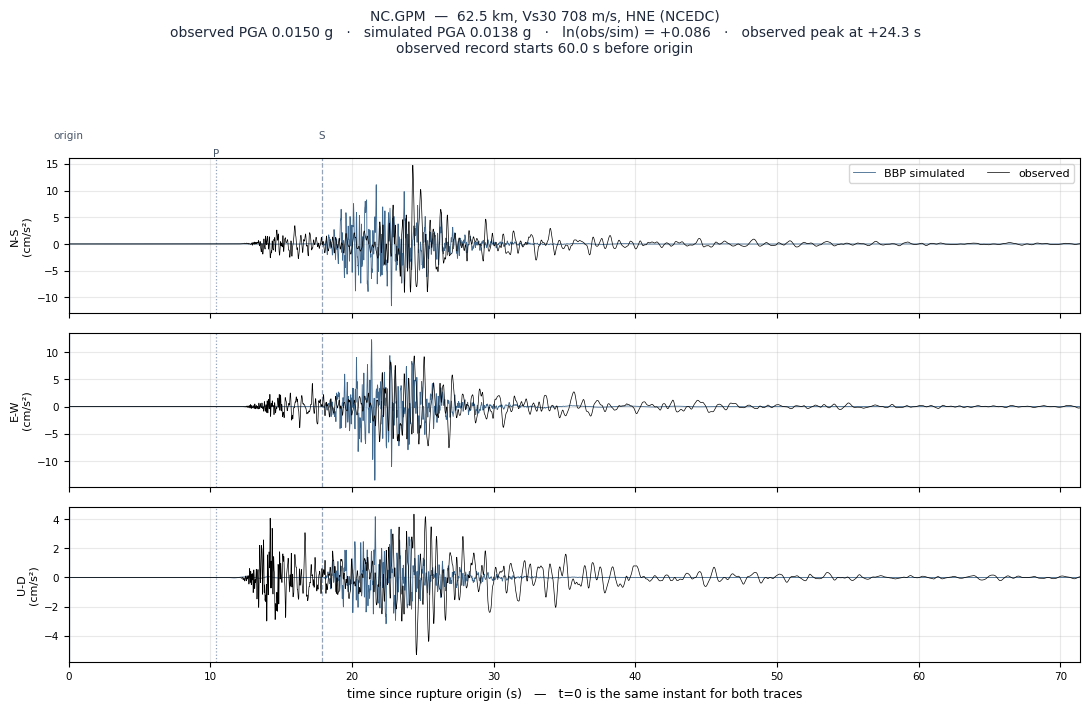
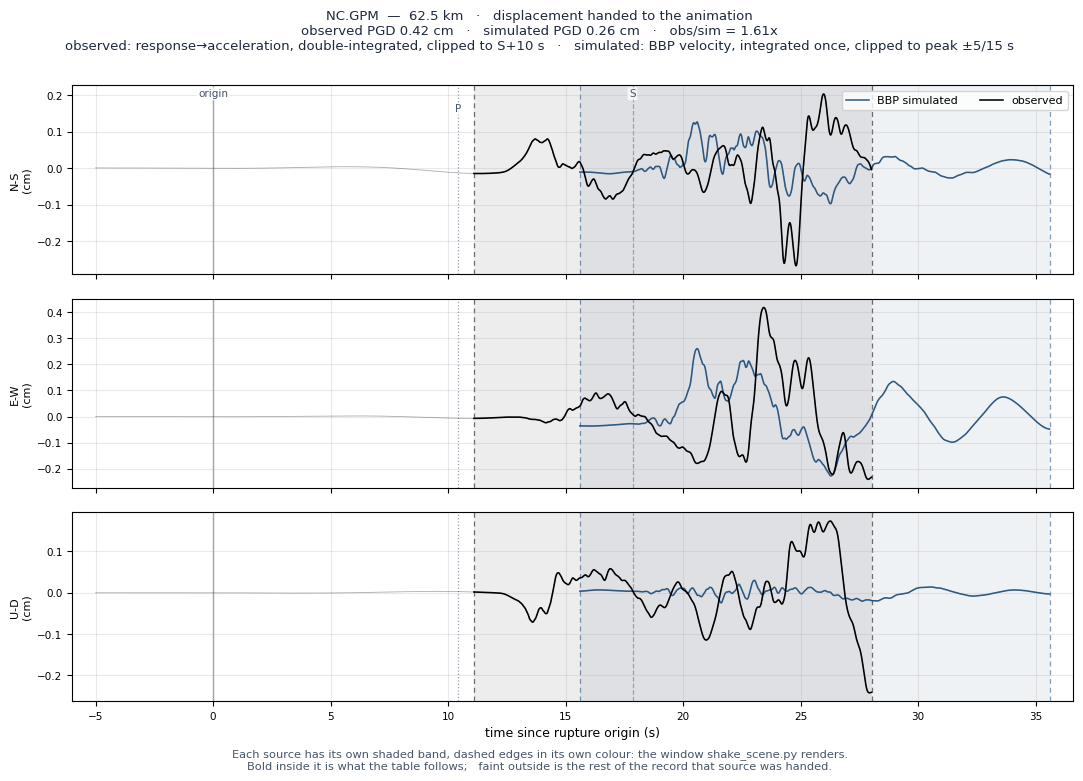
| NC.GPM | 62.5 | 708 | 708 | HNE | 0.0151 | 0.0150 | 0.0138 | 1.3 | 1.5 | 0.8 | 0.42 | 0.26 | 1.61x | +0.086 | — |
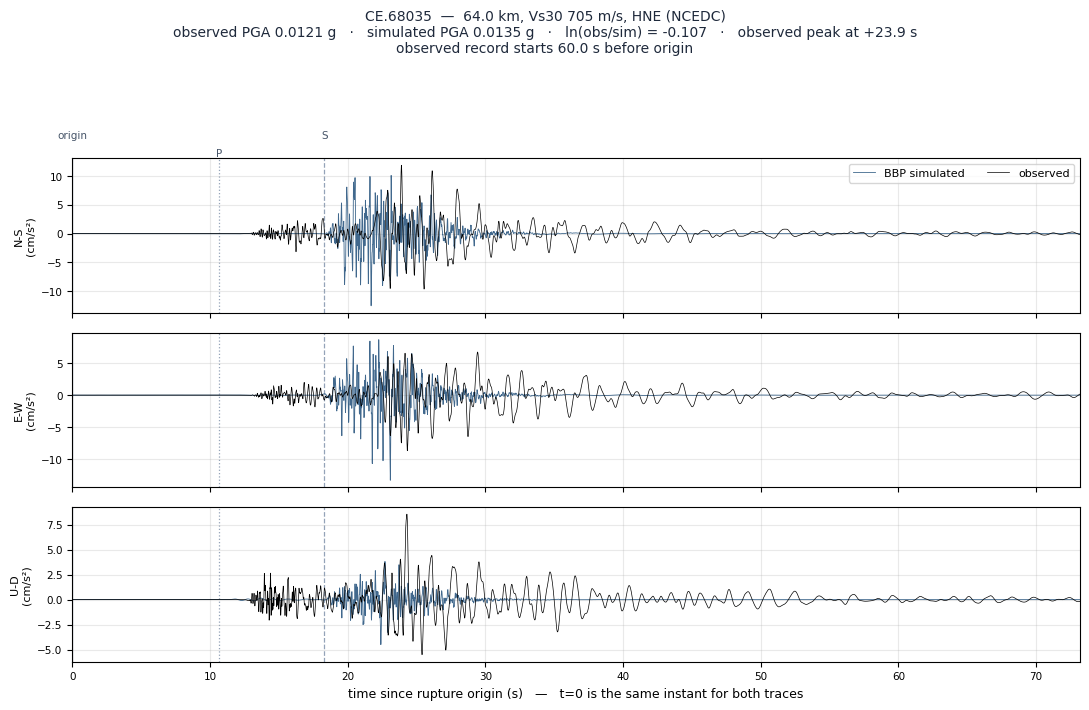
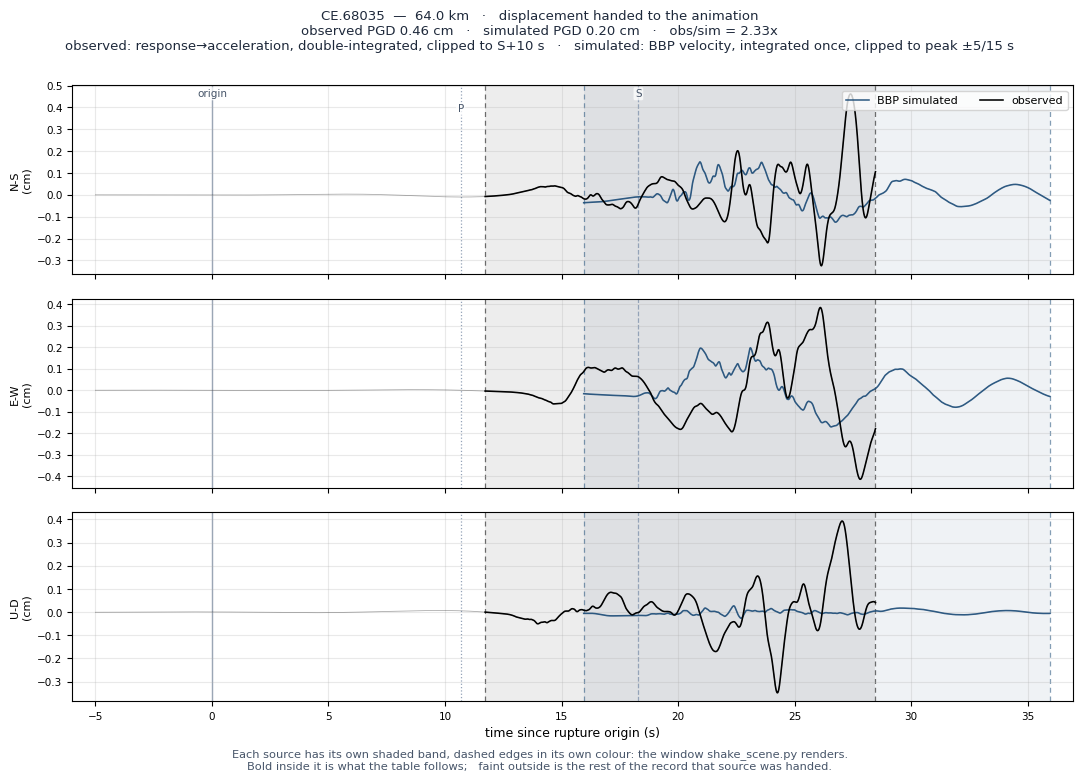
| CE.68035 | 64.0 | 705 | 705 | HNE | 0.0121 | 0.0121 | 0.0135 | 1.4 | 1.6 | 0.8 | 0.46 | 0.20 | 2.33x | -0.107 | — |
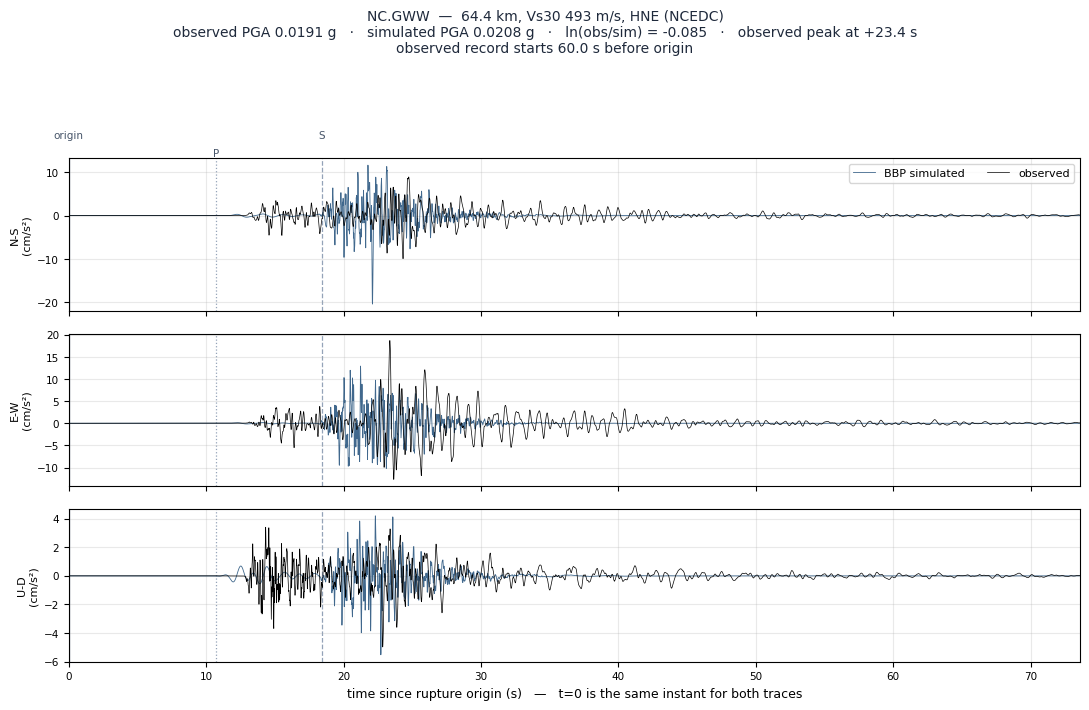
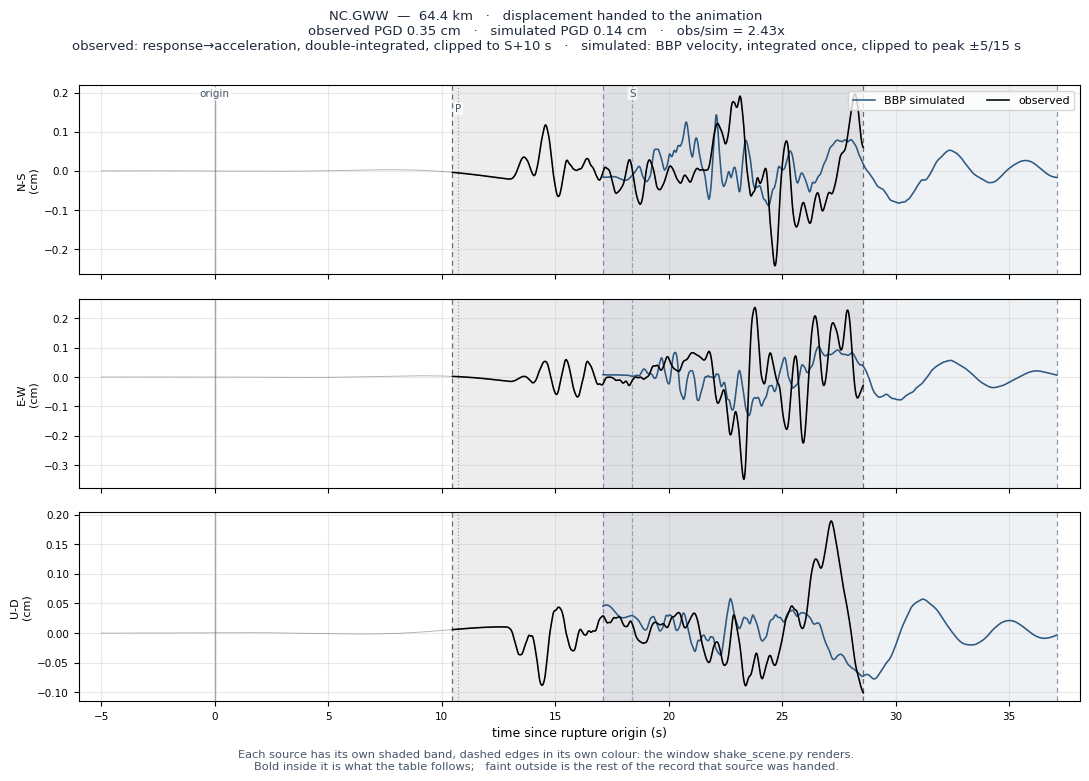
| NC.GWW | 64.4 | 493 | 493 | HNE | 0.0190 | 0.0191 | 0.0208 | 2.2 | 2.2 | 1.1 | 0.35 | 0.14 | 2.43x | -0.085 | — |
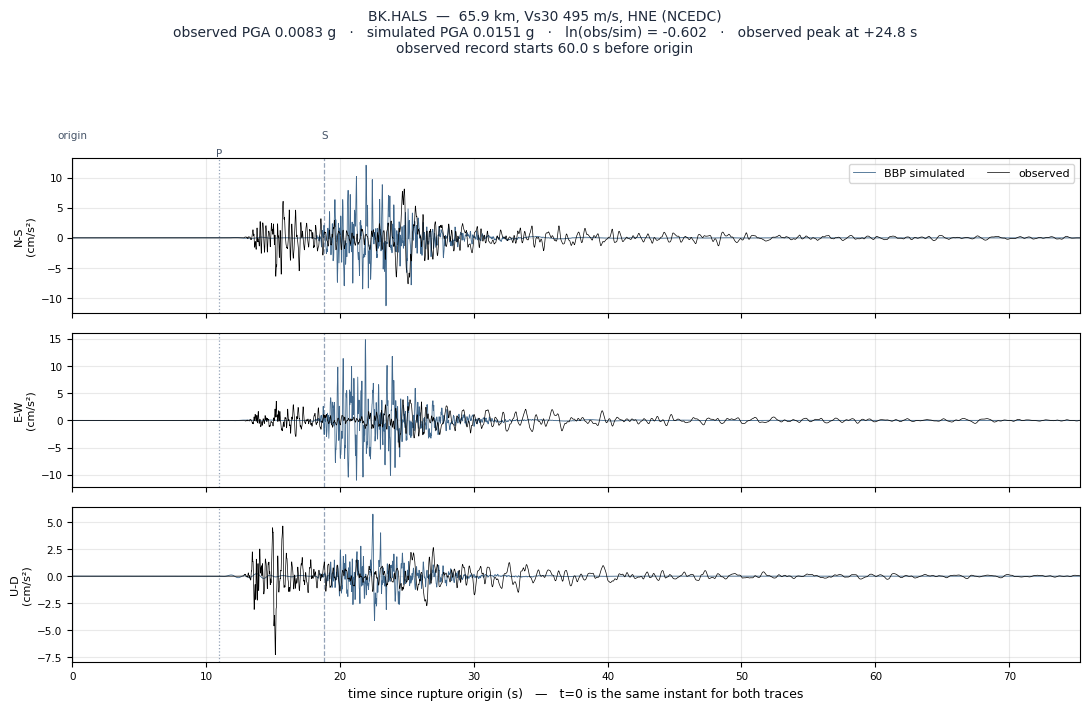
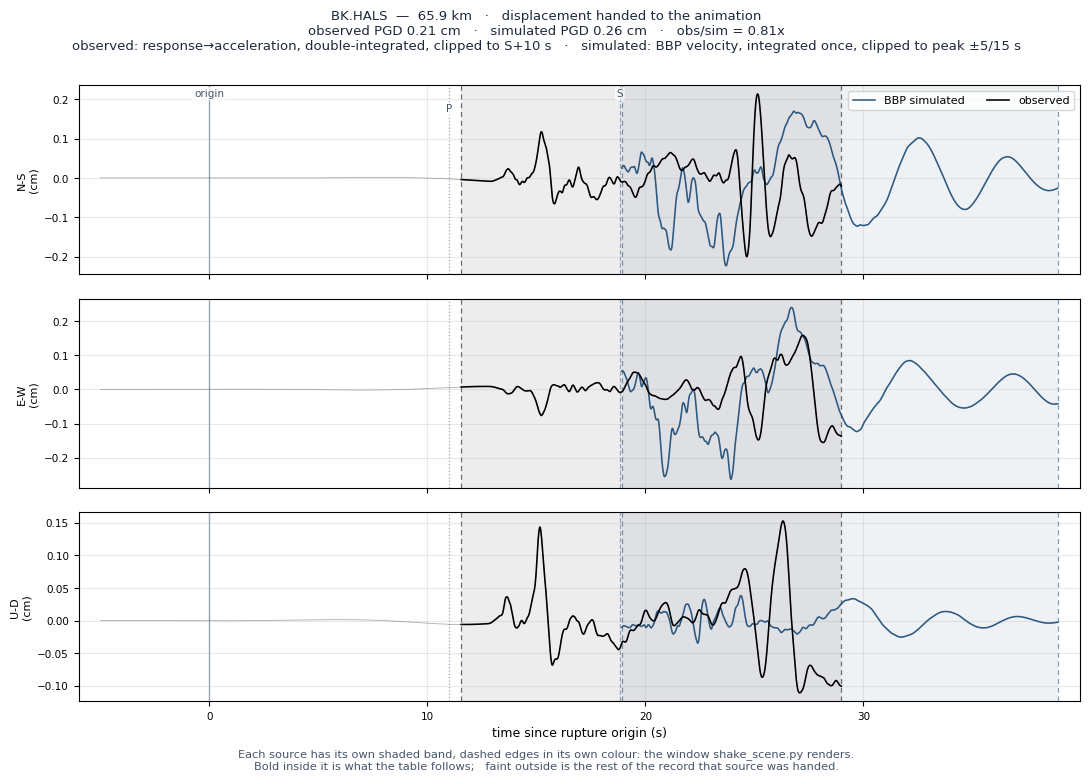
| BK.HALS | 65.9 | 495 | 495 | HNE | 0.0081 | 0.0083 | 0.0151 | 1.5 | 1.5 | 0.9 | 0.21 | 0.26 | 0.81x | -0.602 | — |
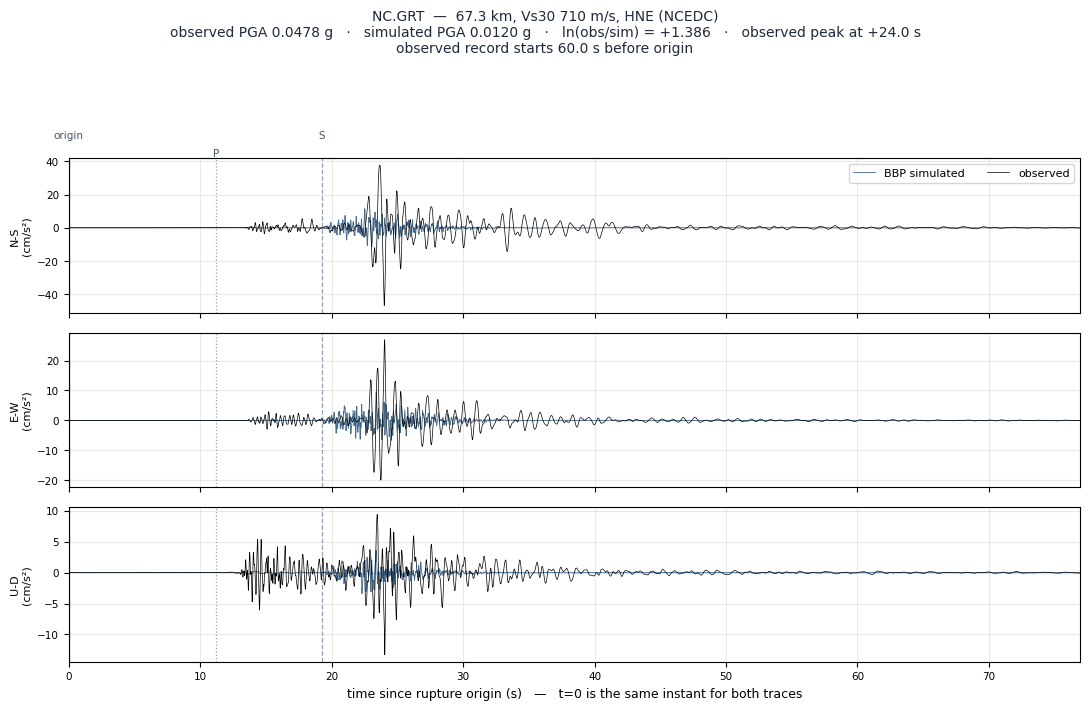
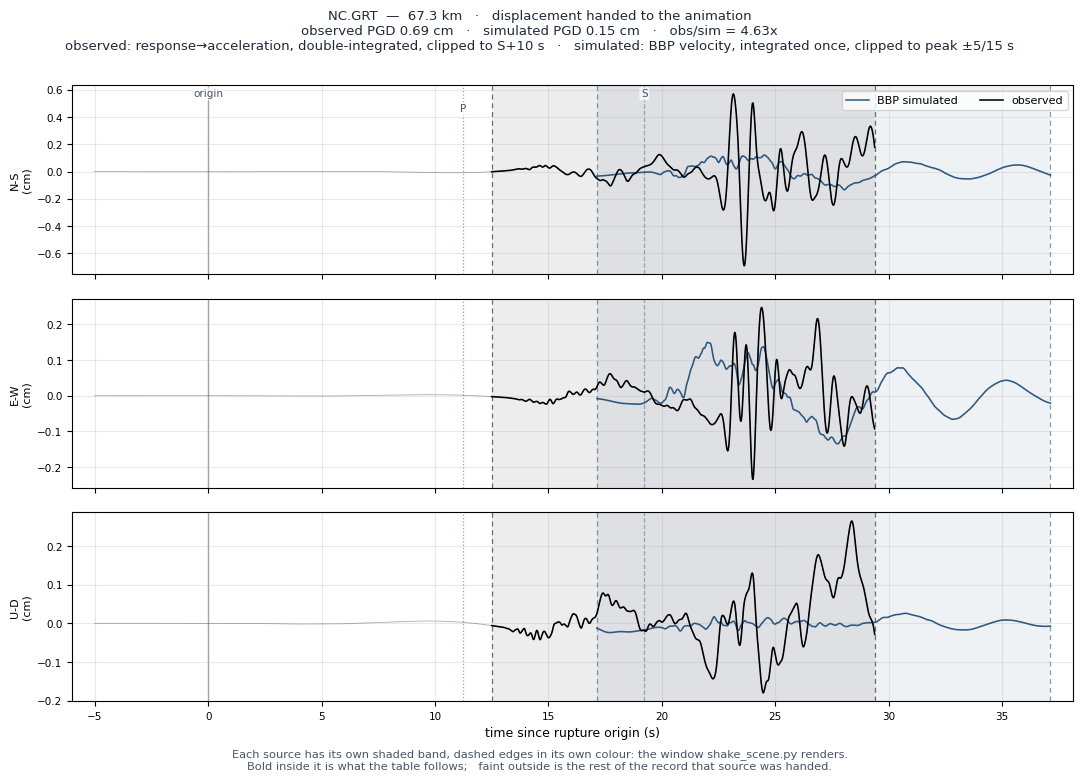
| NC.GRT | 67.3 | 710 | 710 | HNE | 0.0489 | 0.0478 | 0.0120 | 5.0 | 5.0 | 0.6 | 0.69 | 0.15 | 4.63x | +1.386 | Outl |
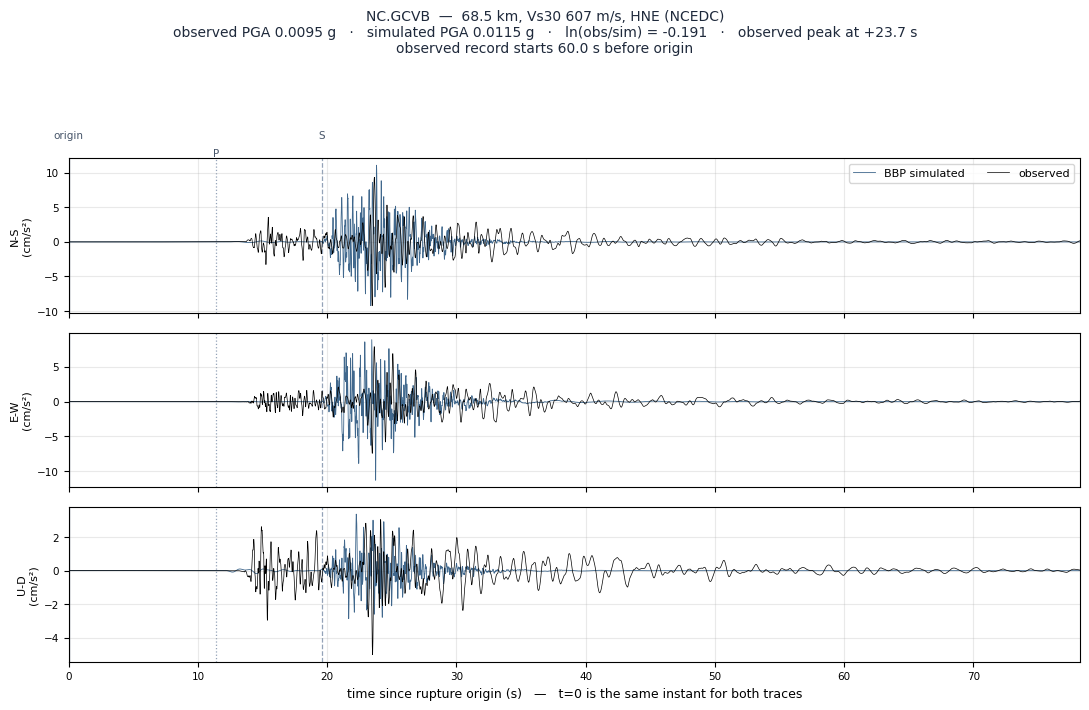
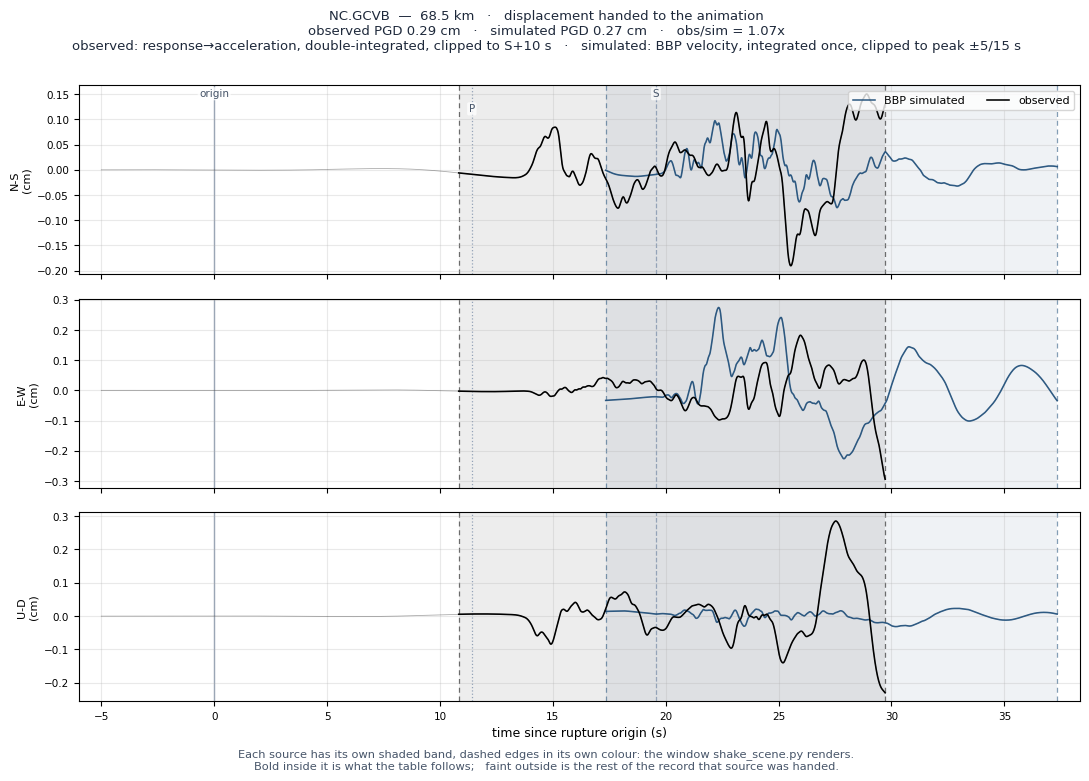
| NC.GCVB | 68.5 | 607 | 607 | HNE | 0.0096 | 0.0095 | 0.0115 | 0.8 | 0.9 | 0.8 | 0.29 | 0.27 | 1.07x | -0.191 | — |
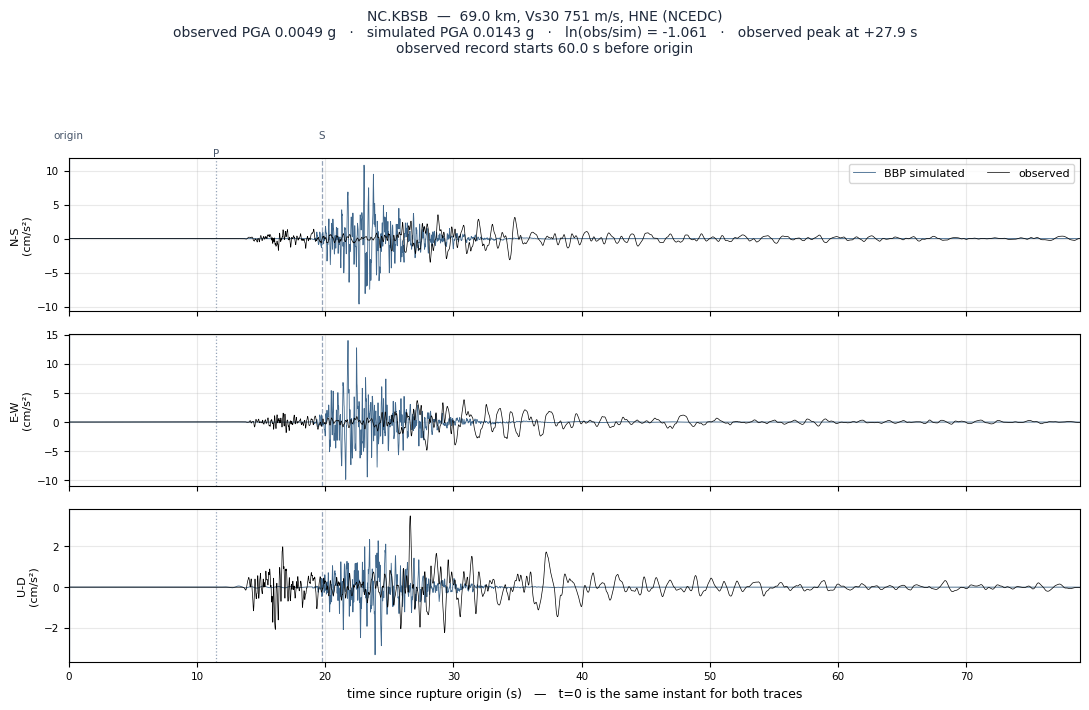
| NC.KBSB | 69.0 | 751 | 751 | HNE | 0.0049 | 0.0049 | 0.0143 | 1.1 | 1.1 | 0.8 | 0.31 | 0.22 | 1.39x | -1.061 | — |
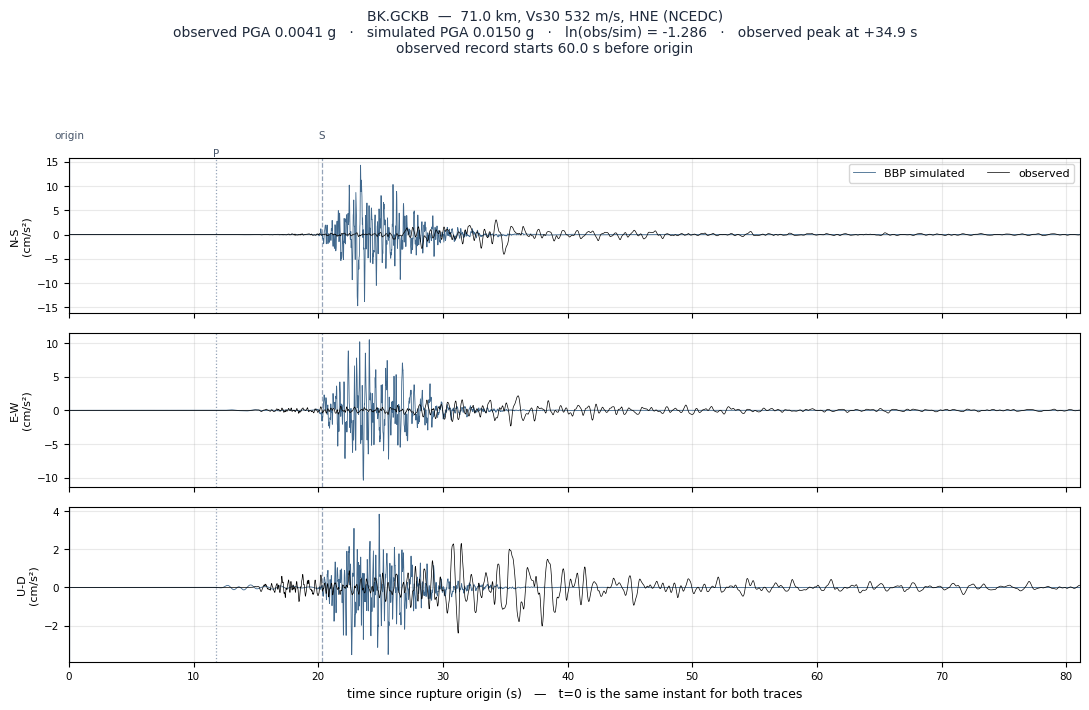
| BK.GCKB | 71.0 | 532 | 532 | HNE | 0.0042 | 0.0041 | 0.0150 | 1.0 | 0.9 | 1.2 | 0.25 | 0.23 | 1.08x | -1.286 | — |
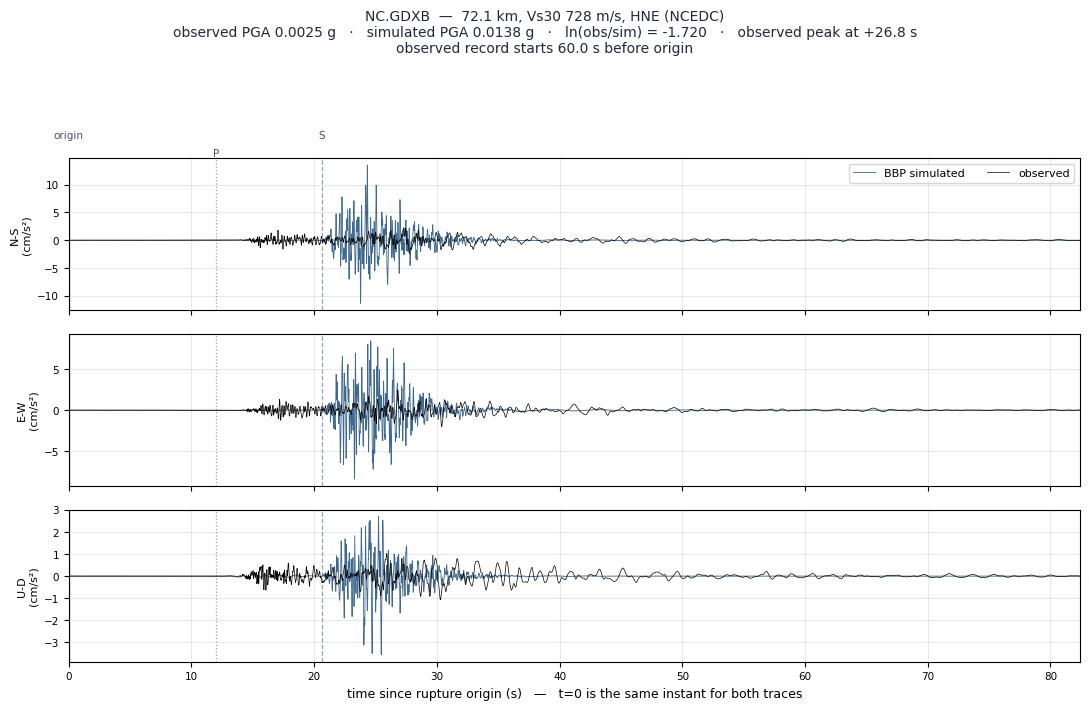
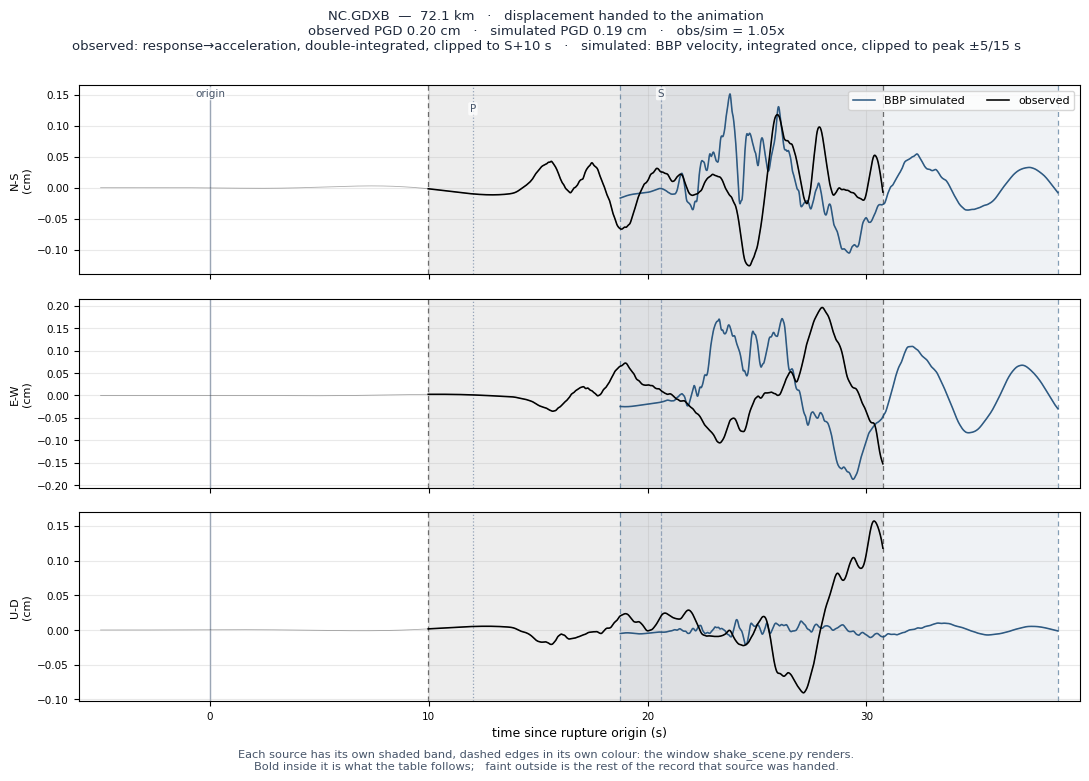
| NC.GDXB | 72.1 | 728 | 728 | HNE | 0.0025 | 0.0025 | 0.0138 | 0.4 | 0.4 | 0.7 | 0.20 | 0.19 | 1.05x | -1.720 | — |
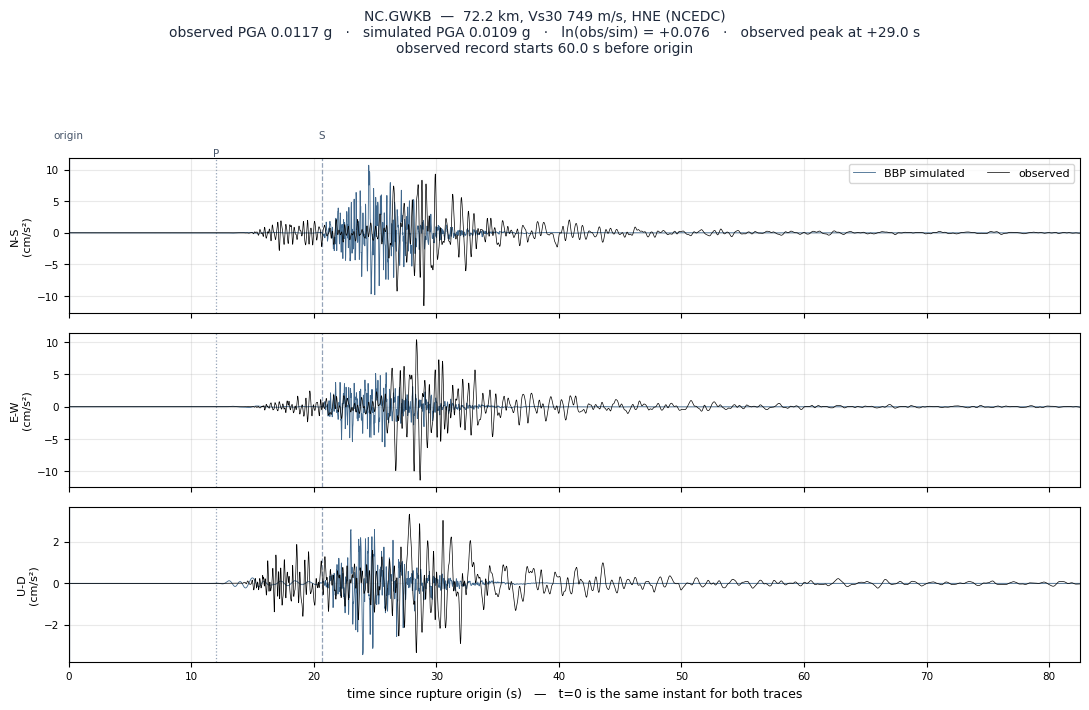
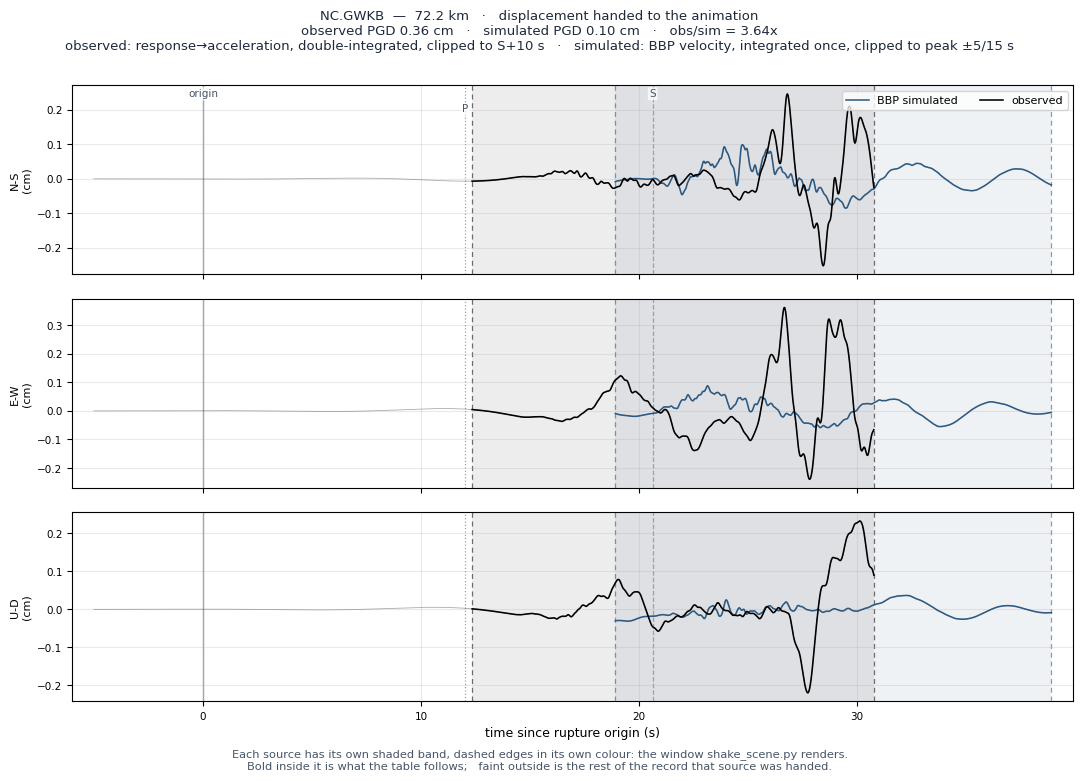
| NC.GWKB | 72.2 | 749 | 749 | HNE | 0.0119 | 0.0117 | 0.0109 | 1.4 | 1.5 | 0.8 | 0.36 | 0.10 | 3.64x | +0.076 | — |
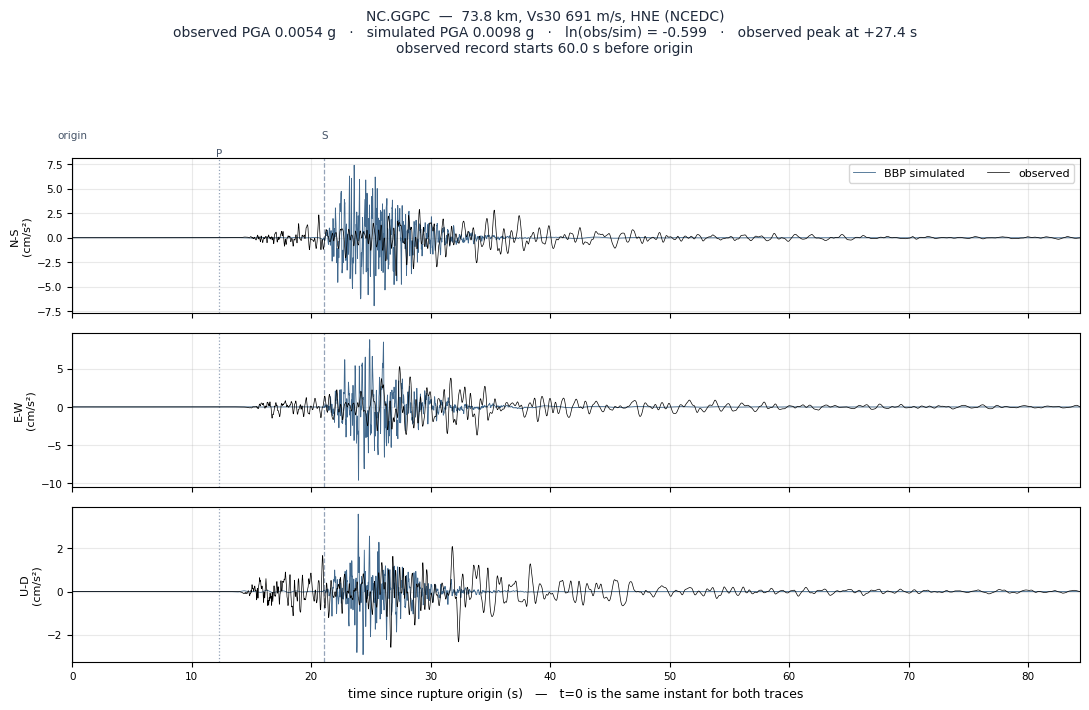
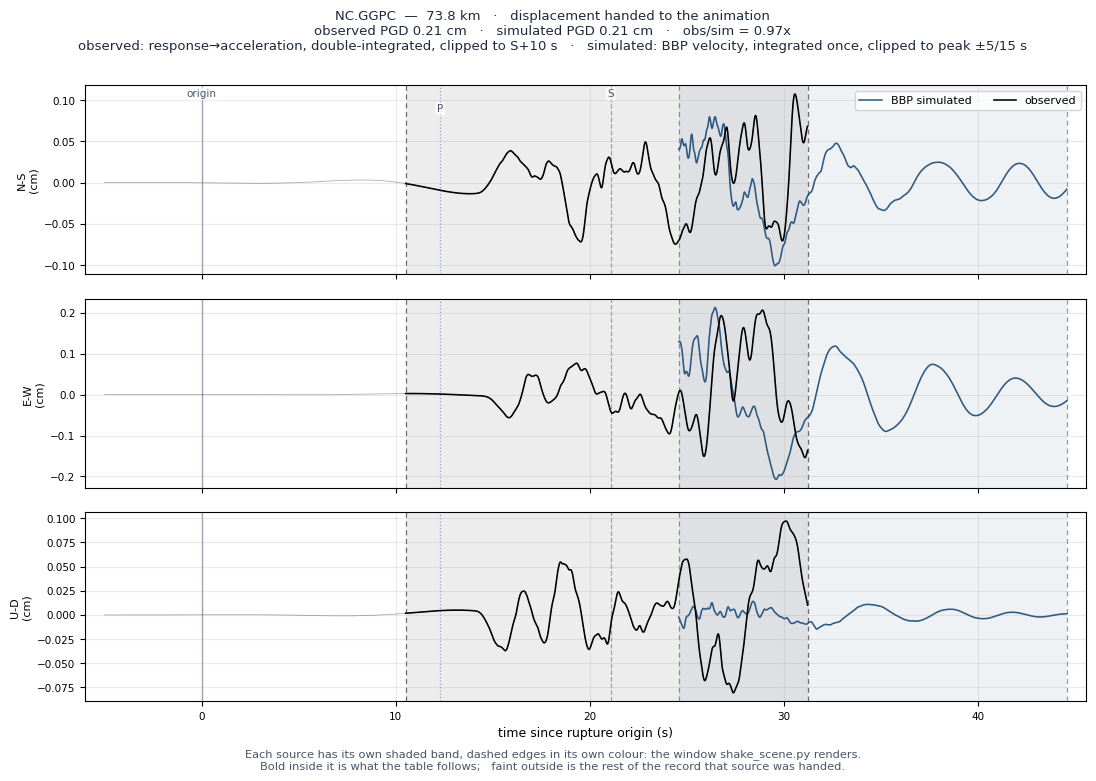
| NC.GGPC | 73.8 | 691 | 691 | HNE | 0.0054 | 0.0054 | 0.0098 | 0.7 | 0.7 | 0.8 | 0.21 | 0.21 | 0.97x | -0.599 | — |
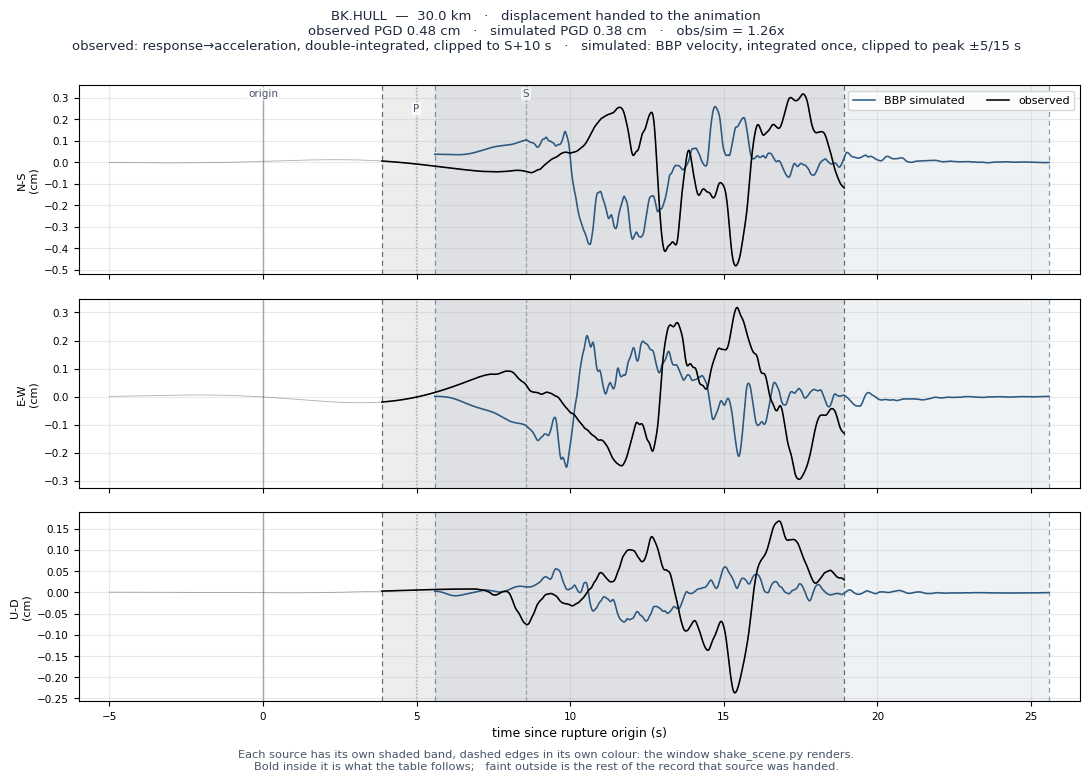
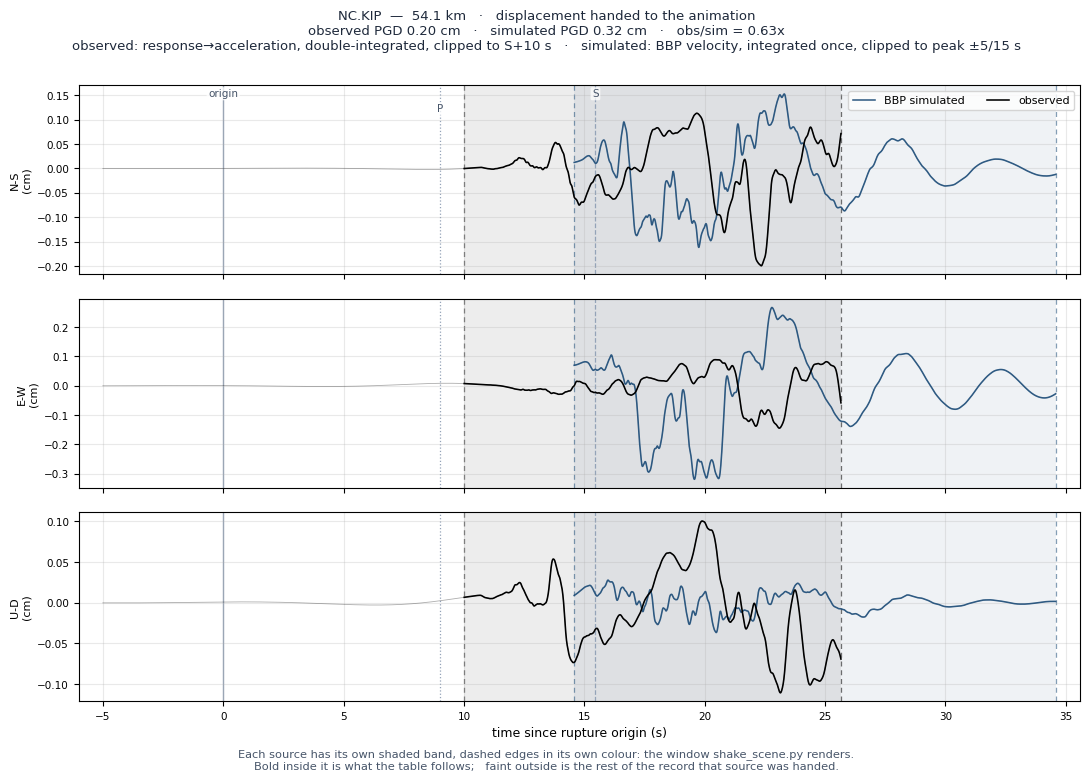
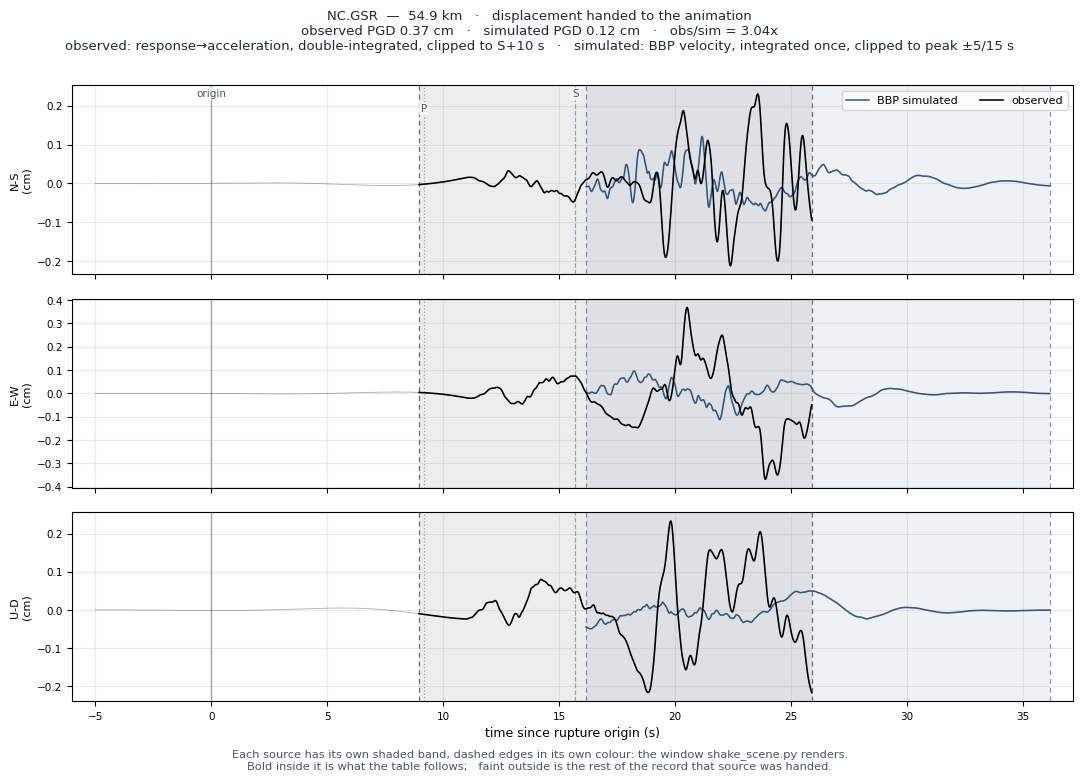
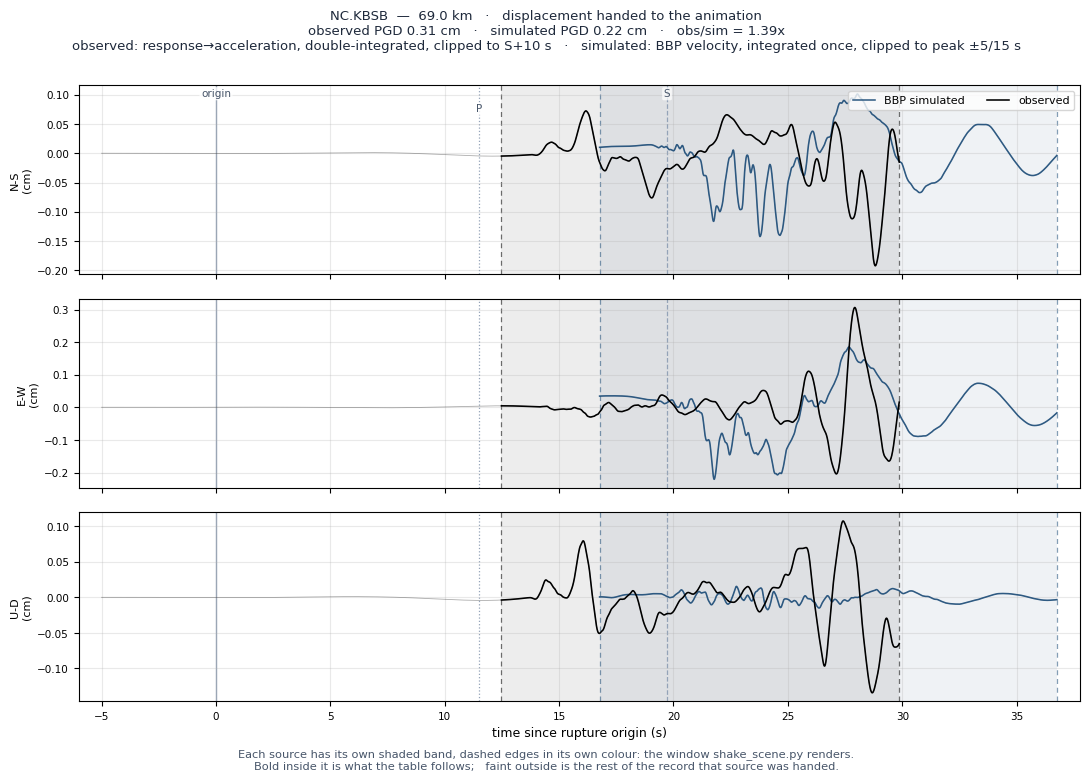
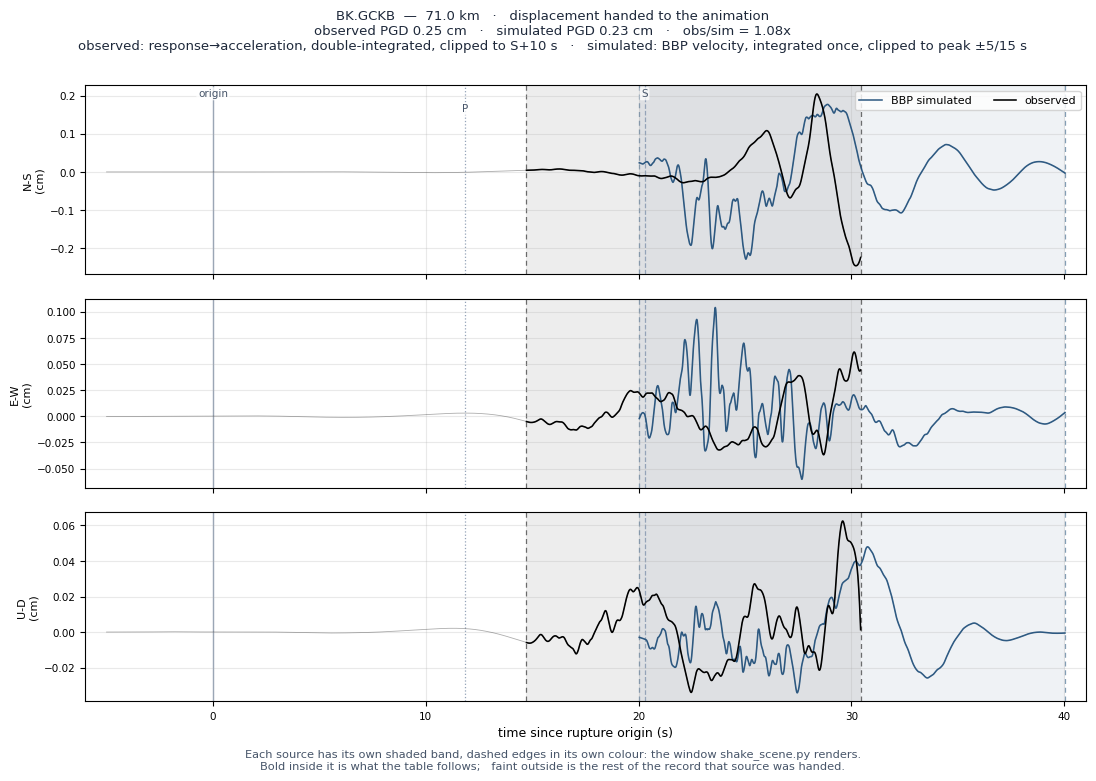
PGD is the animation pipeline's own number on both sides, read from the displacement each side hands to Blender — a different processing chain from the PGA and PGV columns, and from each other. See the displacement pages at the end.
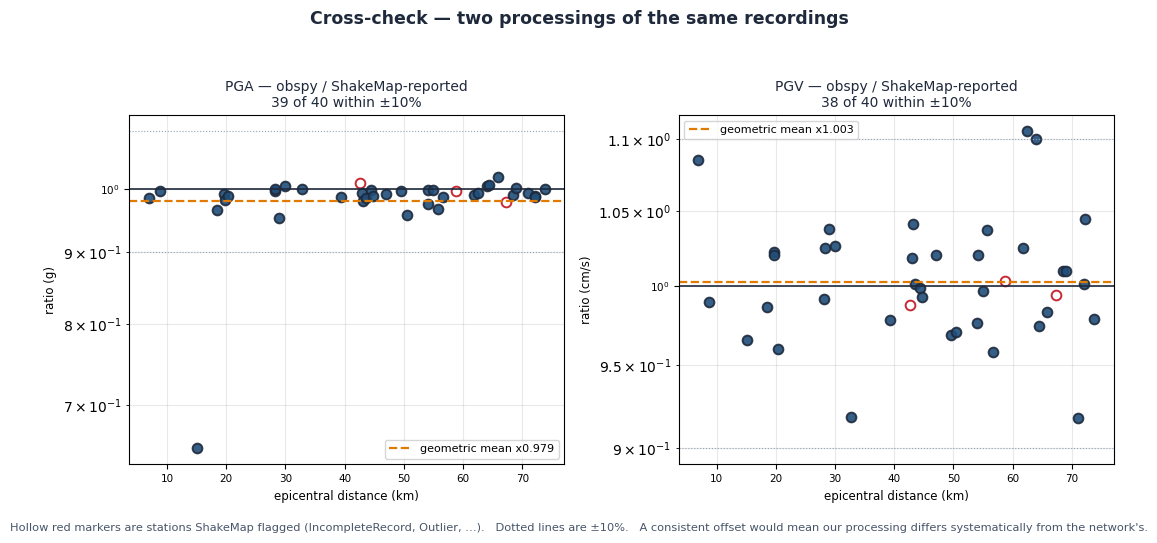
Cross-check — how far apart are the two ‘observed’ sources?
The amplitudes the network reported in ShakeMap against the same recordings re-fetched and processed here. These should agree closely; where they do not, the ShakeMap quality flags usually explain why. A systematic offset here would be a processing fault, not physics.
Residual against distance
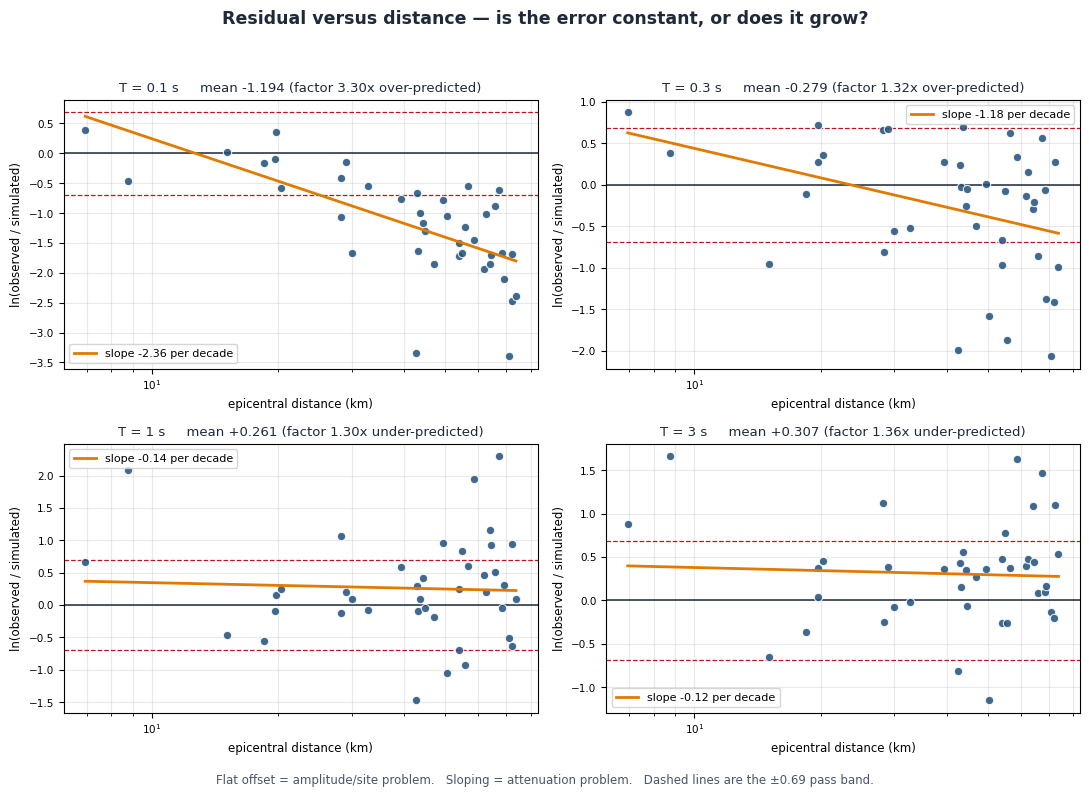
A trend with distance points at the attenuation model rather than the source: the simulation losing energy faster or slower than the real crust does.
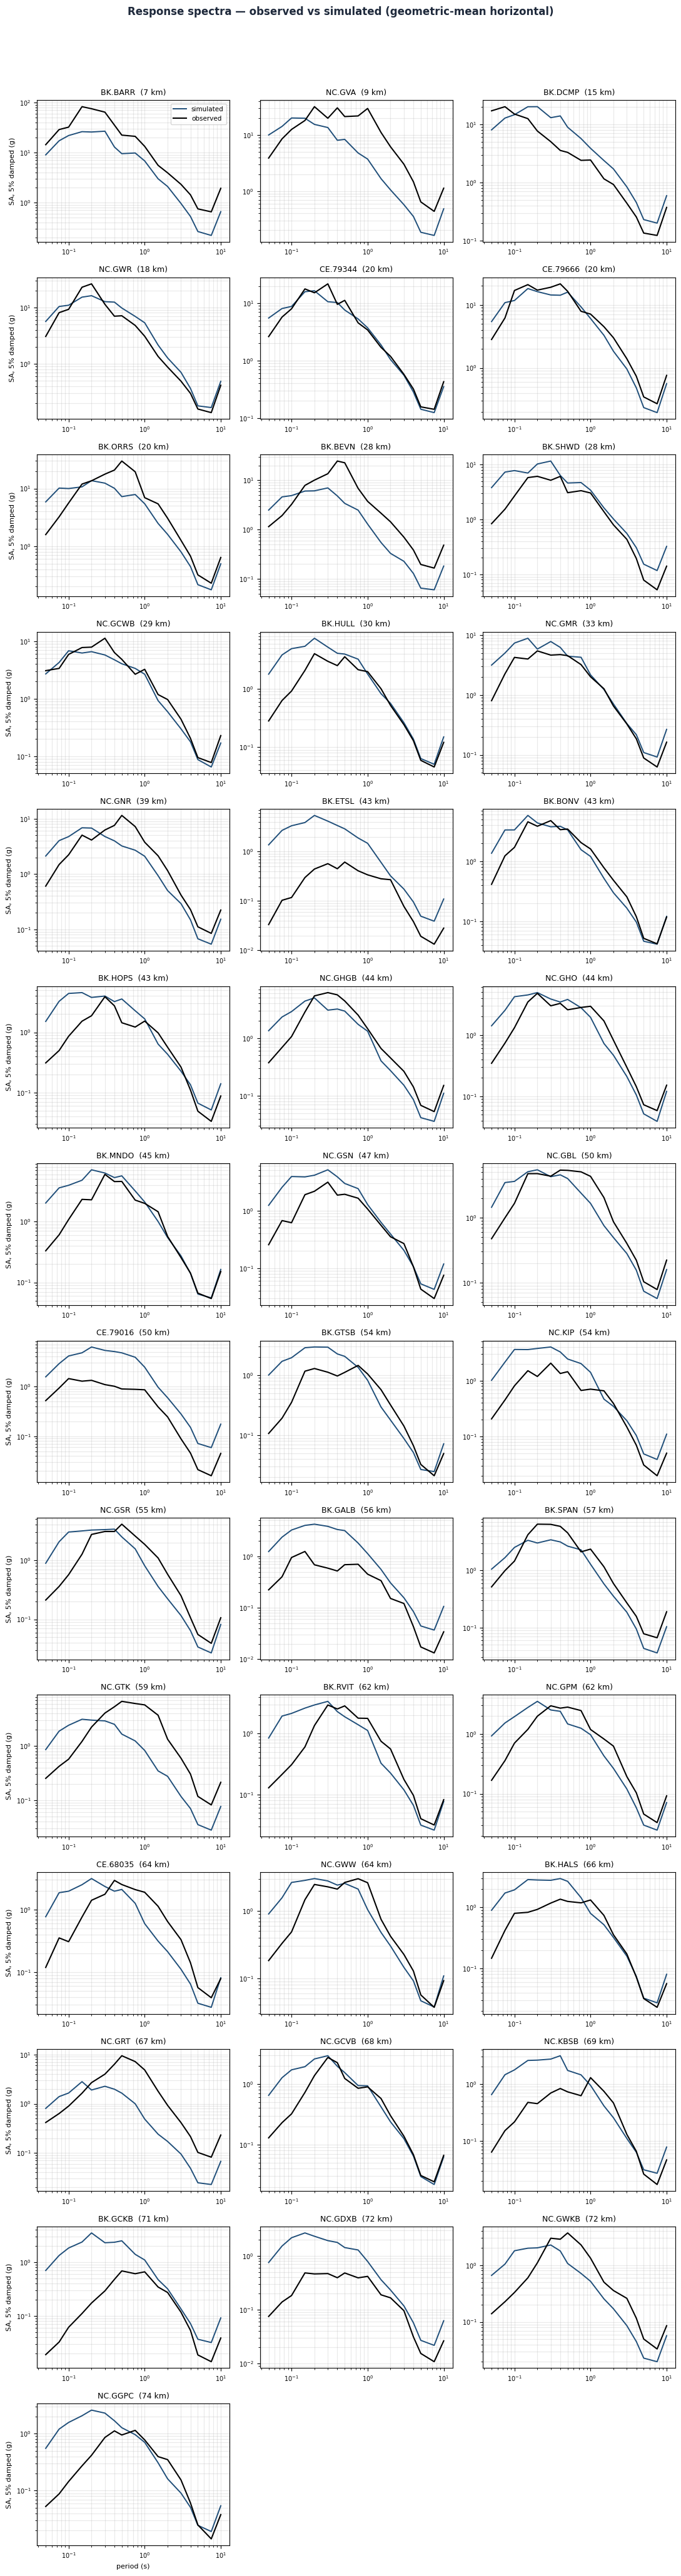
Response spectra, station by station
Observed and simulated response spectra at every compared station.
Per-station detail
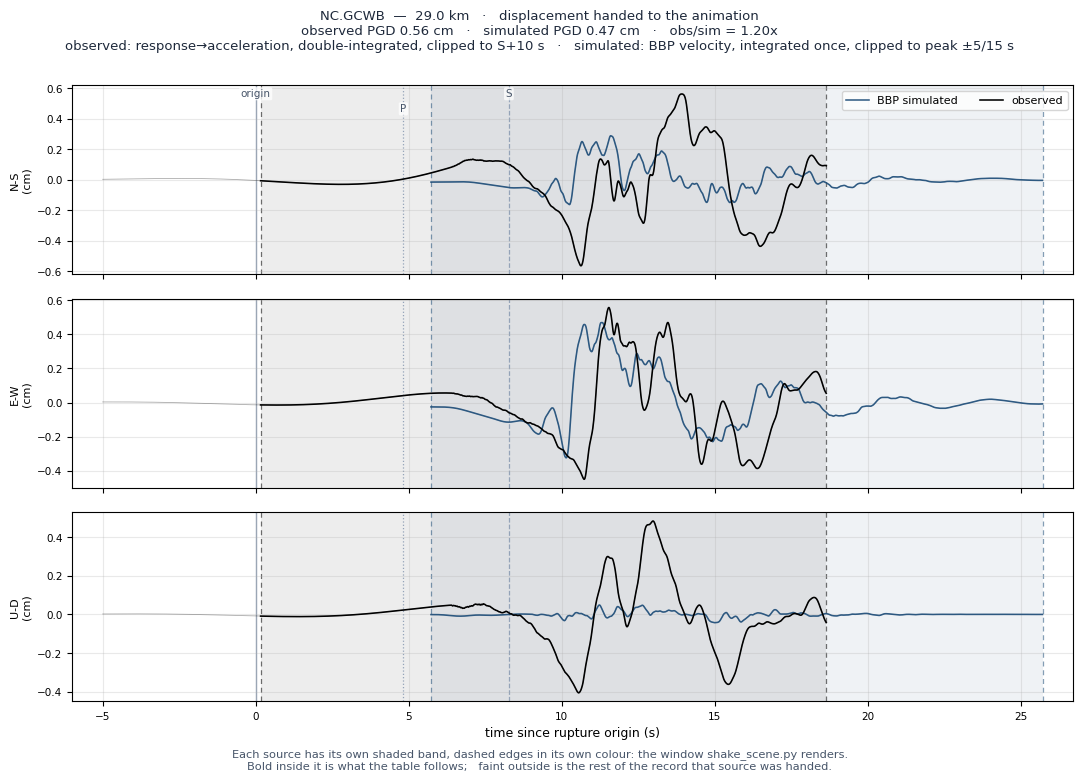
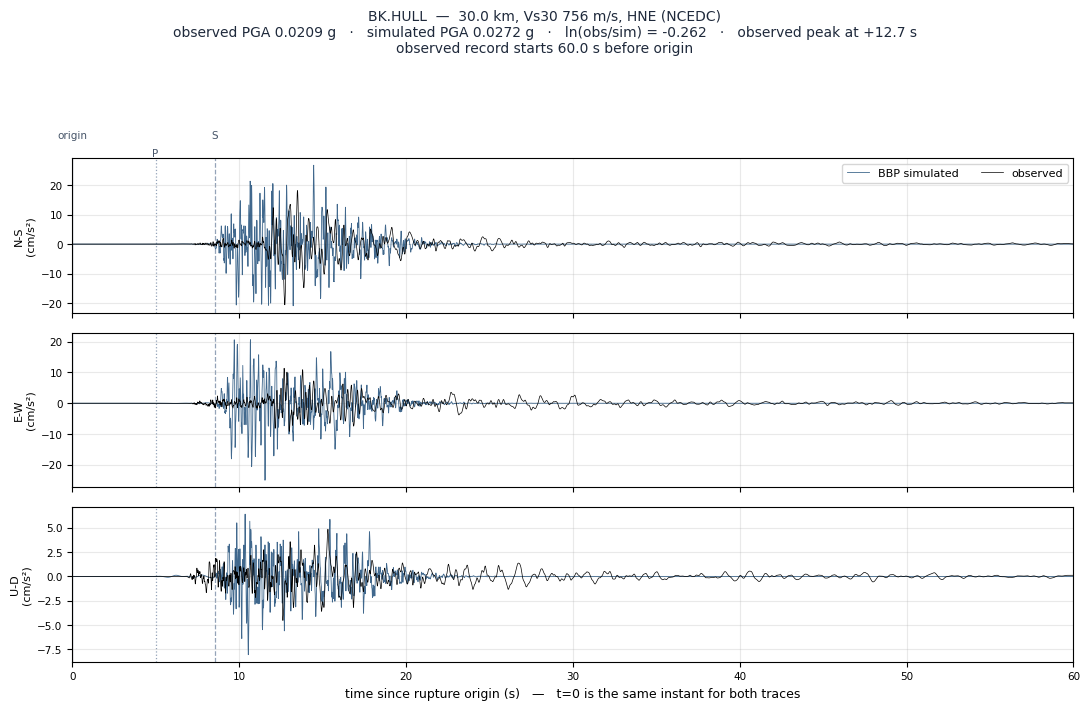
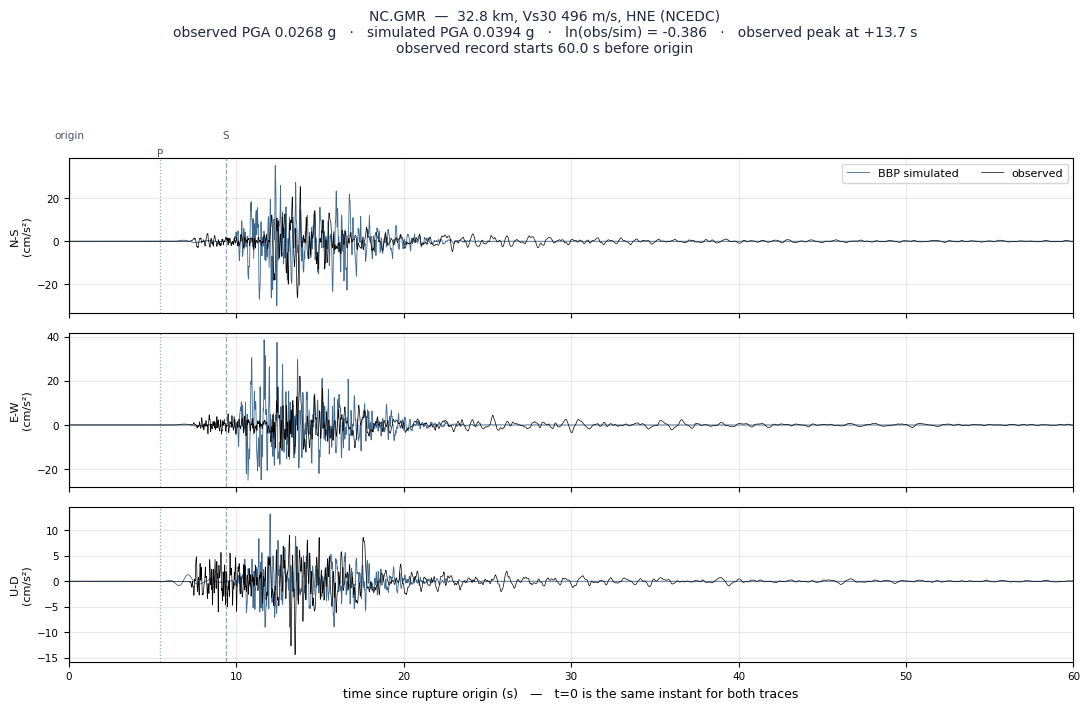
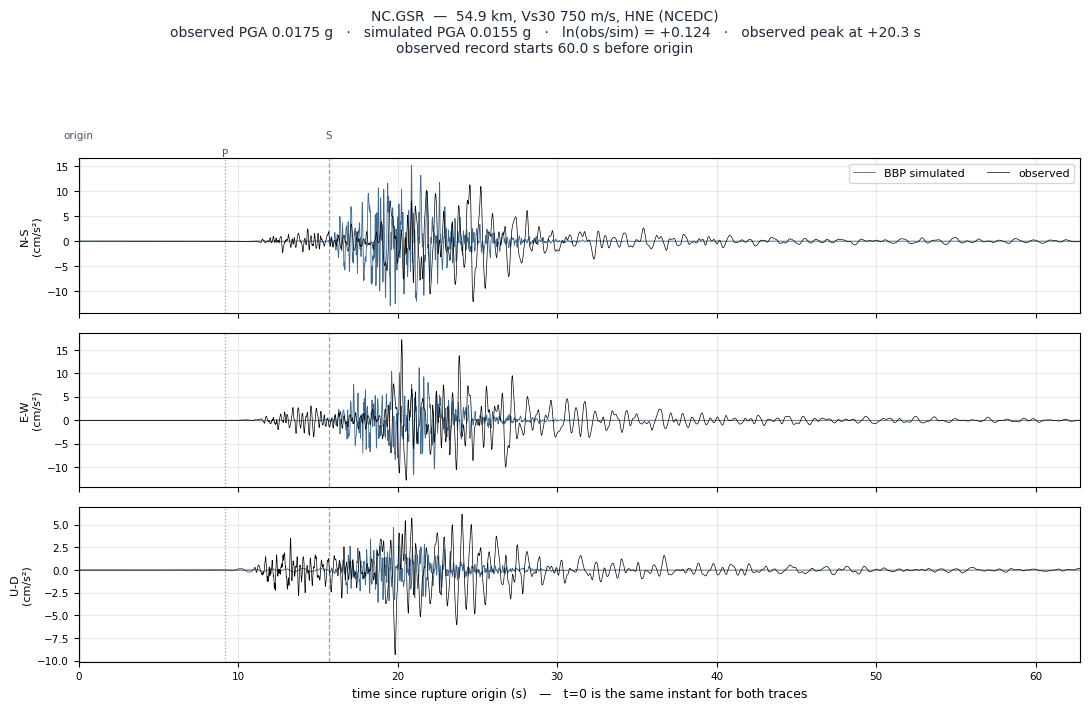
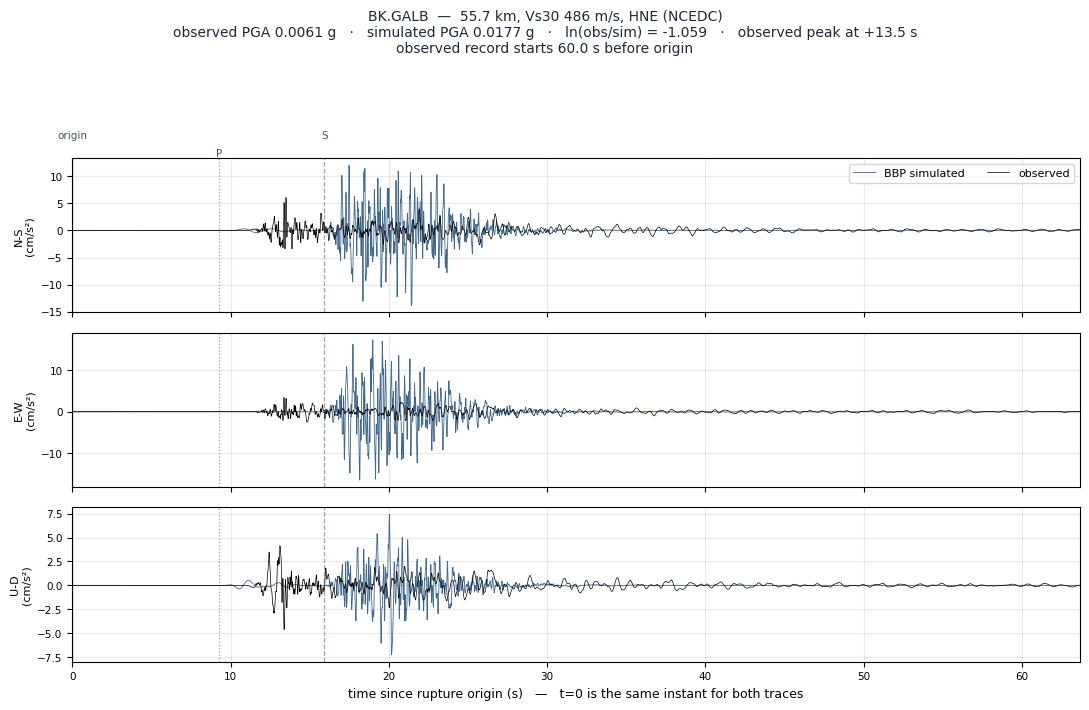
Nearest first. Open a station for its three-component waveform overlay and the displacement record that drives the shaking animations. Figures load when opened.
BK.BARR 6.9 km ln(obs/sim) +1.226
NC.GVA 8.8 km ln(obs/sim) +0.628
BK.DCMP 15.1 km ln(obs/sim) -0.717
NC.GWR 18.5 km ln(obs/sim) +0.083
CE.79344 19.7 km ln(obs/sim) +0.271
CE.79666 19.8 km ln(obs/sim) +0.496
BK.ORRS 20.3 km ln(obs/sim) +0.170
BK.BEVN 28.2 km ln(obs/sim) +1.152
BK.SHWD 28.3 km ln(obs/sim) -0.691
NC.GCWB 29.0 km ln(obs/sim) +0.331
BK.HULL 30.0 km ln(obs/sim) -0.262
NC.GMR 32.8 km ln(obs/sim) -0.386
NC.GNR 39.3 km ln(obs/sim) +0.303
BK.ETSL 42.6 km ln(obs/sim) -1.910
BK.BONV 43.0 km ln(obs/sim) -0.224
BK.HOPS 43.2 km ln(obs/sim) -0.494
NC.GHGB 43.6 km ln(obs/sim) +0.462
NC.GHO 44.4 km ln(obs/sim) -0.227
BK.MNDO 44.7 km ln(obs/sim) -0.133
NC.GSN 47.0 km ln(obs/sim) -0.815
NC.GBL 49.5 km ln(obs/sim) +0.363
CE.79016 50.5 km ln(obs/sim) -1.323
BK.GTSB 54.1 km ln(obs/sim) -0.725
NC.KIP 54.1 km ln(obs/sim) -0.957
NC.GSR 54.9 km ln(obs/sim) +0.124
BK.GALB 55.7 km ln(obs/sim) -1.059
BK.SPAN 56.6 km ln(obs/sim) +0.406
NC.GTK 58.7 km ln(obs/sim) +0.821
BK.RVIT 61.8 km ln(obs/sim) +0.011
NC.GPM 62.5 km ln(obs/sim) +0.086
CE.68035 64.0 km ln(obs/sim) -0.107
NC.GWW 64.4 km ln(obs/sim) -0.085
BK.HALS 65.9 km ln(obs/sim) -0.602
NC.GRT 67.3 km ln(obs/sim) +1.386
NC.GCVB 68.5 km ln(obs/sim) -0.191
NC.KBSB 69.0 km ln(obs/sim) -1.061
BK.GCKB 71.0 km ln(obs/sim) -1.286
NC.GDXB 72.1 km ln(obs/sim) -1.720
NC.GWKB 72.2 km ln(obs/sim) +0.076
NC.GGPC 73.8 km ln(obs/sim) -0.599
Provenance
Simulation
- produced by
- BBP simulated
- BBP job id
- job_7827afbe58cc416695ae
- BBP version
- 22.4.0
- method
- GP
- realizations
- 1 of 1 succeeded — a single stochastic rupture, not an ensemble; the bias below is one draw
- realization used
- r0001
- sites in job spec
- —
- job submitted
- 2026-08-04T21:54:40Z
- per-site Vs30 from
- submit-time record (/app/plots/gof_work/nc75382936/compare/station_specs.json)
Source parameters
- magnitude used
- —
- hypocentre
- —
- depth
- —
- strike / dip / rake
- —
- mechanism source
- USGS moment tensor, nodal plane 1 — the conjugate plane is equally consistent with the tensor and gives different amplitudes
Velocity model
- region used
- NoCal500
- native for this location
- Mojave500 — not installed, so the run is approximate. LABasin500 carries a deep sedimentary basin that Ridgecrest does not have, which would amplify 0.3-1 s motion.
- calibration
- M5.59 against GP's ~M5.5 floor
- platform
- arm64 under emulation — amplitudes are not SCEC-reference-accurate; this number measures BBP plus Rosetta and cannot separate them
Observed data and processing
Station selection
- search radius
- 100.0 km
- policy
- all usable within radius
- stations on event
- 639
- without FDSN code
- 0 — cannot be queried at all
- candidates
- 67
- usable records
- 65 (2 returned no usable 3-component set)
- in this report
- 40 with both observed and simulated
- distance range
- 6.9 – 73.8 km
Instrumentation
- channel priority
- HN?, EN?, HH?, BH?, EH?
- channels used
- HN
- data centres
- NCEDC
- mixed instrument types
- no
- Vs30 source
- ShakeMap stationlist (per-station)
Signal processing
- window
- origin −60.0 s to +300.0 s (requested)
- records not starting as requested
- none
- response removal
- to acceleration and velocity separately, pre-filter (0.05, 0.1, 20.0, 25.0) Hz
- resampled to
- 100.0 Hz
- time origin
- t = 0 is the rupture origin for both observed and simulated traces on every overlay
How to read this report
The metric
- definition
- ln(observed / simulated) RotD50 spectral acceleration, averaged across stations at each period.
- sign
- POSITIVE means the simulation under-predicts — real shaking was larger. NEGATIVE means it over-predicts.
- scale
- It is a log ratio: ±0.10 is about ±10%, ±0.69 is a factor of 2, ±1.10 is a factor of 3.
- sigma
- The station-to-station spread around that average. A large sigma with a small bias means the model is right on average and wrong site by site.
Reading the pattern
- short-period poor,
long-period good - Points at high-frequency attenuation or near-surface site response rather than the source.
- long-period poor,
short-period good - Points at the source — corner frequency, stress drop — or at basin response in the velocity model.
- one station far off
- Usually 3D site or directivity effects that a 1D layered velocity model cannot reproduce by construction. Check whether it is driving the sigma before treating it as model error.
What this does not tell you
- A pass means the simulation is consistent with recordings at these stations, for this event, under this velocity model, on this hardware. It is not a general statement about BBP, and it is not a prediction of accuracy at an unrecorded site.