Max Est. MMI
77 km ENE of Tonopah, Nevada
Ground Shaking Intensities — Interpolated ShakeMap MMI
3 sites| Location | MMI |
|---|---|
|
Tonopah
NV |
I |
|
Goldfield
NV |
I |
|
Eureka
NV |
I |
Seismic Station Observed MMI
MMI values are derived directly from observed ground motion measurements at seismic stations and are not spatially interpolated.
| Station | MMI |
|---|---|
| Twin Springs Ranch, NV, CEMP (QN.TSRA) | II |
| Carvers, NV, USA - NN reactivation (NN.Q09A) | I |
| Tonopah Central Nevada Museum, NV, CEMP (QN.TCNM) | I |
Engineering Ground Motion Parameters
GMPE predictions provide an independent check on the ShakeMap interpolated intensities above.
ShakeMap relies on seismic station recordings; in areas with sparse station coverage — or
for large teleseismic events and earthquakes outside dense West Coast networks — ShakeMap
MMI can be inaccurate. A significant difference between ShakeMap and GMPE estimates is a signal
that the ShakeMap result should be treated as preliminary.
Also includes site Vs30 values and raw ground motion parameters (PGA/PGV).
Show ▼
Engineering Ground Motion Parameters
GMPE predictions provide an independent check on the ShakeMap interpolated intensities above. ShakeMap relies on seismic station recordings; in areas with sparse station coverage — or for large teleseismic events and earthquakes outside dense West Coast networks — ShakeMap MMI can be inaccurate. A significant difference between ShakeMap and GMPE estimates is a signal that the ShakeMap result should be treated as preliminary. Also includes site Vs30 values and raw ground motion parameters (PGA/PGV).
Site-Specific Vs30 Values
Shear-wave velocity in the upper 30 m, used for GMPE predictions.
| Location | Default Vs30 (m/s) | Site-Specific Vs30 (m/s) |
|---|---|---|
|
Tonopah
NV |
760 | 544 |
|
Goldfield
NV |
760 | 433 |
|
Eureka
NV |
760 | 563 |
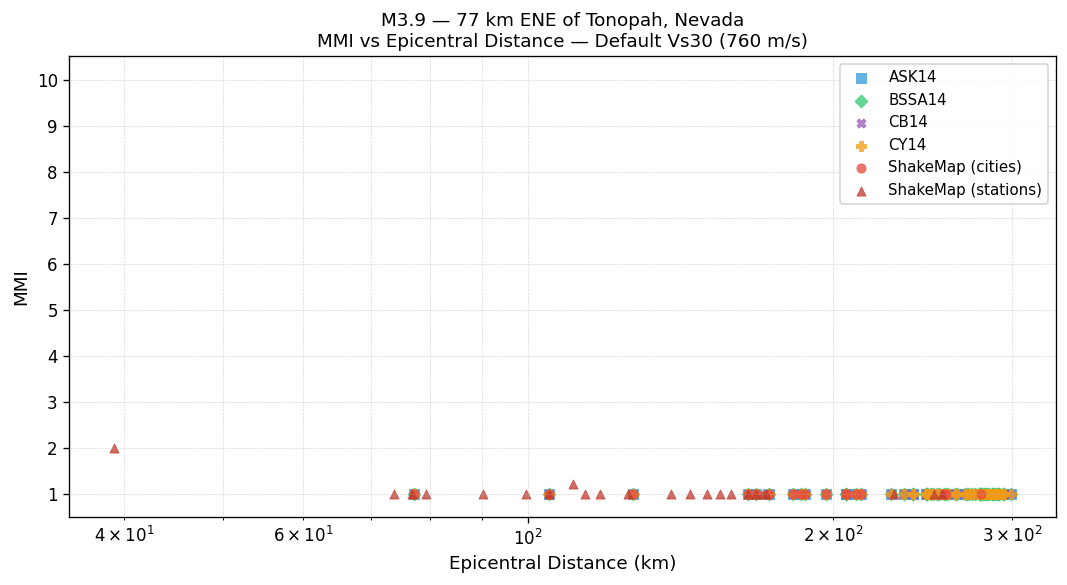
MMI vs Distance — Default Vs30 (760 m/s)
All methods using the 760 m/s rock-site reference. ShakeMap values are independent of Vs30.
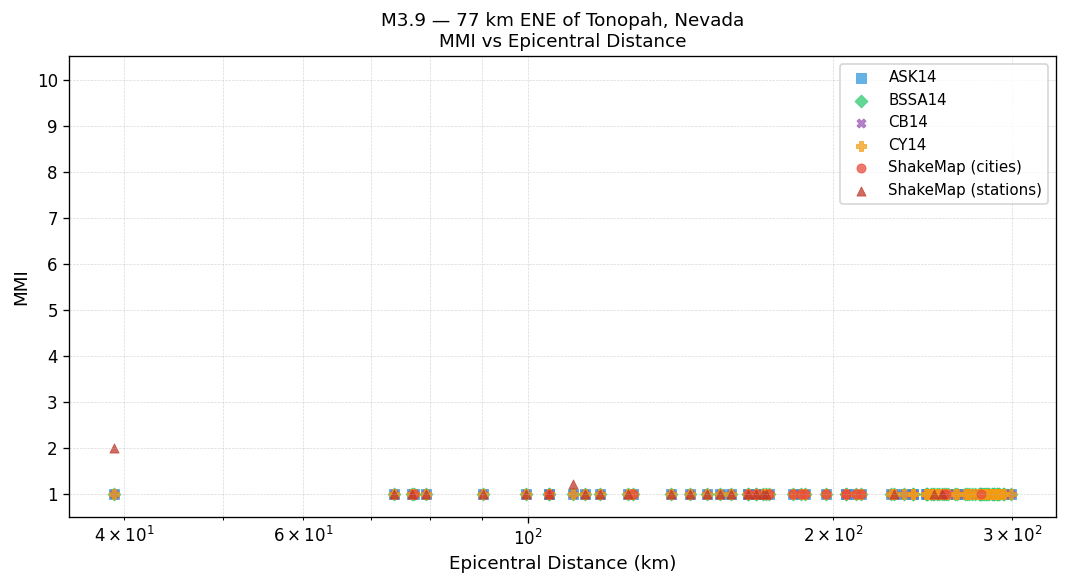
MMI vs Distance — Site-Specific Vs30
GMPEs use the site-specific Vs30 values shown in the table above. ShakeMap values are unchanged.
Peak Ground Motion Values — USGS ShakeMap
PGA and PGV interpolated from the USGS ShakeMap grid for this event. Values reflect ShakeMap's ground motion model, not GMPE estimates.
| Location | PGA (%g) | PGV (cm/s) |
|---|---|---|
|
Tonopah
NV |
0.0275 | 0.008 |
|
Goldfield
NV |
0.0205 | 0.006 |
|
Eureka
NV |
0.0199 | 0.008 |